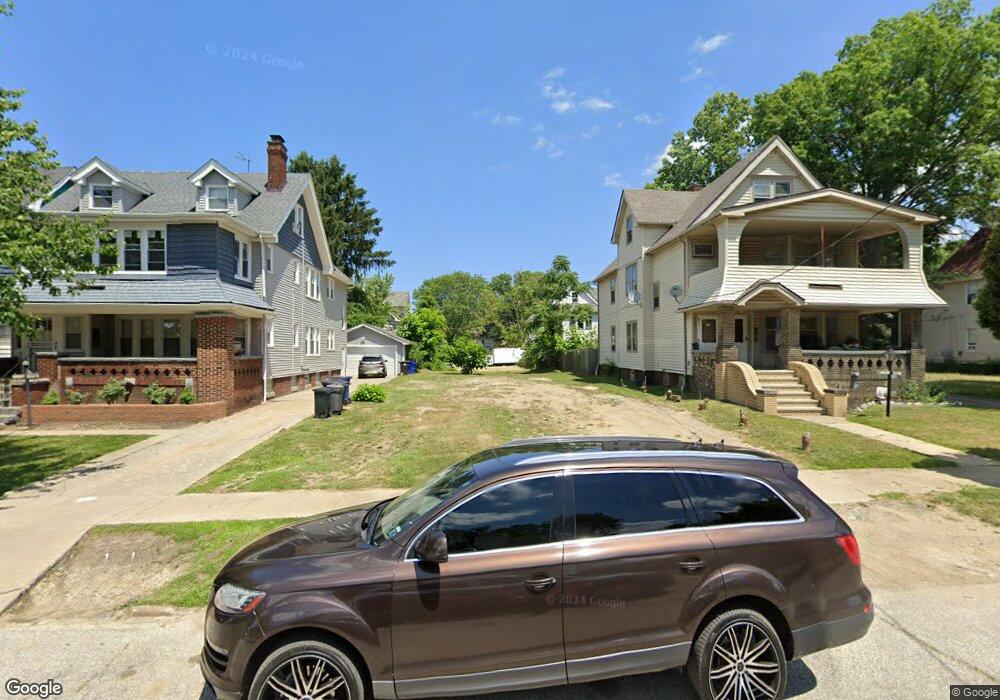
12317 Tuscora Ave Cleveland, OH 44108
Forest Hills NeighborhoodEstimated Value: $81,000 - $157,944
5
Beds
3
Baths
2,789
Sq Ft
$43/Sq Ft
Est. Value
About This Home
This home is located at 12317 Tuscora Ave, Cleveland, OH 44108 and is currently estimated at $120,736, approximately $43 per square foot. 12317 Tuscora Ave is a home located in Cuyahoga County with nearby schools including Bolton, Anton Grdina School, and Andrew J. Rickoff School.
Ownership History
Date
Name
Owned For
Owner Type
Purchase Details
Closed on
Jul 29, 2024
Sold by
Sheriff Of Cuyahoga County
Bought by
Program Cleveland Land Reutilization
Current Estimated Value
Purchase Details
Closed on
Nov 20, 2012
Sold by
Gibbs Marilyn
Bought by
Warsing James
Purchase Details
Closed on
Dec 23, 2005
Sold by
Nix Robert Earl
Bought by
Gibbs Marilyn
Home Financials for this Owner
Home Financials are based on the most recent Mortgage that was taken out on this home.
Original Mortgage
$83,700
Interest Rate
6.48%
Mortgage Type
Fannie Mae Freddie Mac
Purchase Details
Closed on
Jul 6, 1999
Sold by
Nix Mary L
Bought by
Nix Robert Earl
Purchase Details
Closed on
Oct 20, 1987
Sold by
Mary L Nix
Bought by
Collier John and Collier Mary L
Purchase Details
Closed on
Jun 9, 1981
Sold by
Nix Mary L
Bought by
Mary L Nix
Purchase Details
Closed on
Mar 27, 1981
Sold by
Norman Vernon O
Bought by
Nix Mary L
Purchase Details
Closed on
Jan 1, 1975
Bought by
Norman Vernon O
Create a Home Valuation Report for This Property
The Home Valuation Report is an in-depth analysis detailing your home's value as well as a comparison with similar homes in the area
Home Values in the Area
Average Home Value in this Area
Purchase History
| Date | Buyer | Sale Price | Title Company |
|---|---|---|---|
| Program Cleveland Land Reutilization | -- | None Listed On Document | |
| Warsing James | -- | None Available | |
| Gibbs Marilyn | $93,000 | Shaker | |
| Nix Robert Earl | -- | -- | |
| Collier John | -- | -- | |
| Mary L Nix | $21,700 | -- | |
| Nix Mary L | $21,700 | -- | |
| Norman Vernon O | -- | -- |
Source: Public Records
Mortgage History
| Date | Status | Borrower | Loan Amount |
|---|---|---|---|
| Previous Owner | Gibbs Marilyn | $83,700 |
Source: Public Records
Tax History Compared to Growth
Tax History
| Year | Tax Paid | Tax Assessment Tax Assessment Total Assessment is a certain percentage of the fair market value that is determined by local assessors to be the total taxable value of land and additions on the property. | Land | Improvement |
|---|---|---|---|---|
| 2024 | -- | $630 | $630 | -- |
| 2023 | $374 | $630 | $630 | $0 |
| 2022 | $49 | $630 | $630 | $0 |
| 2021 | $48 | $630 | $630 | $0 |
| 2020 | $47 | $530 | $530 | $0 |
| 2019 | $290 | $1,500 | $1,500 | $0 |
| 2018 | $7,176 | $530 | $530 | $0 |
| 2017 | $1,360 | $530 | $530 | $0 |
| 2016 | $6,861 | $2,530 | $2,210 | $320 |
| 2015 | $5,875 | $2,530 | $2,210 | $320 |
| 2014 | $5,875 | $2,800 | $2,450 | $350 |
Source: Public Records
Map
Nearby Homes
- 12329 Fairport Ave
- 937 Parkway Rd
- 11705 Fairport Ave
- 11907 Thornwood Ave
- 12337 Chesterfield Ave
- 11502 Fairport Ave
- 12006 Castlewood Ave
- 11611 Thornwood Ave
- 1069 Carlyon Rd
- 11603 Thornwood Ave
- 11510 Durant Ave
- 885 Eddy Rd
- 915 Eddy Rd
- 11419 Durant Ave
- 1003 Eddy Rd
- 11316 Durant Ave
- 1111 E 114th St
- 11220 Primrose Ave
- 11515 Hopkins Ave
- 12325 Ingomar Ave
- 12313 Tuscora Ave
- 12321 Tuscora Ave
- 12309 Tuscora Ave
- 12325 Tuscora Ave
- 12305 Tuscora Ave
- 12318 Fairport Ave
- 12329 Tuscora Ave
- 12314 Fairport Ave
- 12322 Tuscora Ave
- 12322 Fairport Ave
- 12318 Tuscora Ave
- 12310 Fairport Ave
- 12314 Tuscora Ave
- 12326 Fairport Ave
- 12301 Tuscora Ave
- 12312 Tuscora Ave
- 12333 Tuscora Ave
- 12326 Tuscora Ave
- 12330 Fairport Ave
- 971 E 123rd St