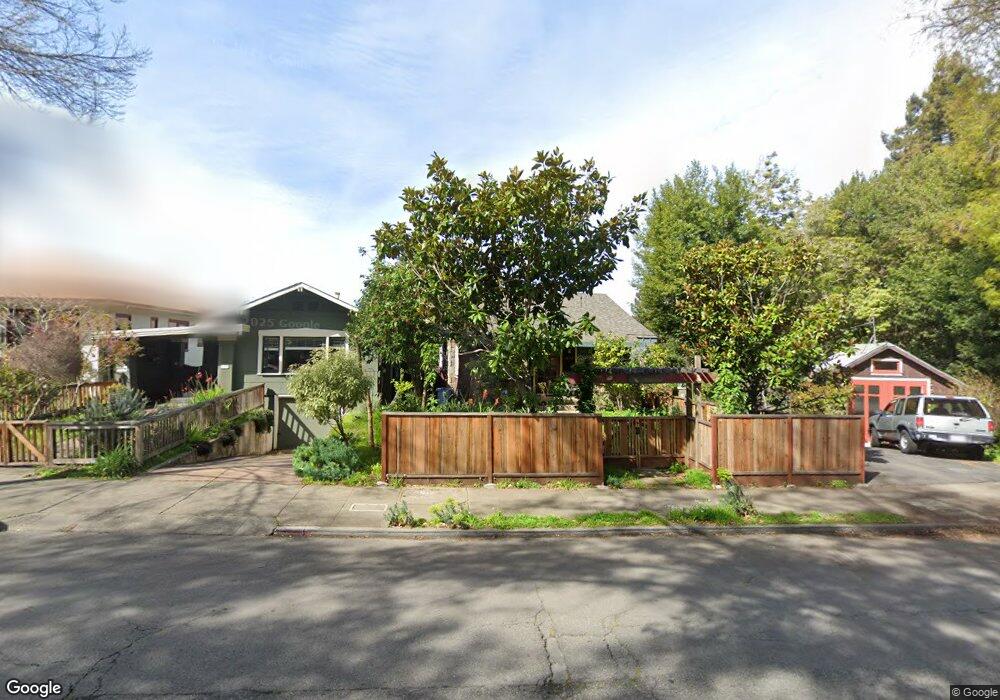
1232 Martin Luther King jr Way Berkeley, CA 94709
North Berkeley NeighborhoodEstimated Value: $1,219,000 - $1,614,000
2
Beds
1
Bath
1,414
Sq Ft
$1,042/Sq Ft
Est. Value
About This Home
This home is located at 1232 Martin Luther King jr Way, Berkeley, CA 94709 and is currently estimated at $1,473,312, approximately $1,041 per square foot. 1232 Martin Luther King jr Way is a home with nearby schools including Berkeley Arts Magnet at Whittier School, Thousand Oaks Elementary School, and Ruth Acty Elementary.
Ownership History
Date
Name
Owned For
Owner Type
Purchase Details
Closed on
Sep 18, 2015
Sold by
Petrov Alisa Jay Katerina and Arden Johnson Petrov Revocable
Bought by
Petrov Alisa Jay Katerina
Current Estimated Value
Purchase Details
Closed on
Aug 18, 2014
Sold by
Petrov Arden Johnson
Bought by
Petrov Arden Johnson and Petrov Alisa Jay Katerina
Purchase Details
Closed on
Jun 15, 2005
Sold by
Petrov George R and Johnson Petrov Arden
Bought by
Johnson Petrov Arden
Home Financials for this Owner
Home Financials are based on the most recent Mortgage that was taken out on this home.
Original Mortgage
$102,000
Interest Rate
5.65%
Mortgage Type
New Conventional
Create a Home Valuation Report for This Property
The Home Valuation Report is an in-depth analysis detailing your home's value as well as a comparison with similar homes in the area
Home Values in the Area
Average Home Value in this Area
Purchase History
| Date | Buyer | Sale Price | Title Company |
|---|---|---|---|
| Petrov Alisa Jay Katerina | -- | None Available | |
| Petrov Arden Johnson | -- | None Available | |
| Johnson Petrov Arden | -- | First American Title Co |
Source: Public Records
Mortgage History
| Date | Status | Borrower | Loan Amount |
|---|---|---|---|
| Closed | Johnson Petrov Arden | $102,000 |
Source: Public Records
Tax History Compared to Growth
Tax History
| Year | Tax Paid | Tax Assessment Tax Assessment Total Assessment is a certain percentage of the fair market value that is determined by local assessors to be the total taxable value of land and additions on the property. | Land | Improvement |
|---|---|---|---|---|
| 2025 | $9,092 | $432,103 | $131,731 | $307,372 |
| 2024 | $9,092 | $423,494 | $129,148 | $301,346 |
| 2023 | $8,825 | $422,053 | $126,616 | $295,437 |
| 2022 | $8,562 | $406,778 | $124,133 | $289,645 |
| 2021 | $8,551 | $398,666 | $121,700 | $283,966 |
| 2020 | $8,013 | $401,508 | $120,452 | $281,056 |
| 2019 | $7,602 | $393,636 | $118,091 | $275,545 |
| 2018 | $7,436 | $385,918 | $115,775 | $270,143 |
| 2017 | $7,159 | $378,354 | $113,506 | $264,848 |
| 2016 | $6,853 | $370,936 | $111,281 | $259,655 |
| 2015 | $7,192 | $365,364 | $109,609 | $255,755 |
| 2014 | $7,091 | $358,208 | $107,462 | $250,746 |
Source: Public Records
Map
Nearby Homes
- 1300 Martin Luther King Junior Way
- 1850 Berryman St
- 1833 Sonoma Ave
- 1614 Posen Ave
- 1521 Josephine St
- 1444 Walnut St
- 1512 Walnut St
- 1609 Bonita Ave Unit 3
- 1609 Bonita Ave Unit 5
- 1610 Milvia St
- 1141 Oxford St
- 1444 Scenic Ave
- 1498 Posen Ave
- 1682 Oxford St
- 2201 Virginia St Unit 2
- 2201 Virginia St Unit 3
- 912 Indian Rock Ave
- 2117 Delaware St Unit B
- 971 Santa Barbara Rd
- 1906 Bonita Ave
- 1220 Martin Luther King Junior Way
- 1234 Martin Luther King jr Way
- 1238 Martin Luther King jr Way
- 1214 The Alameda
- 1240 Martin Luther King jr Way
- 1219 Josephine St
- 1210 The Alameda
- 1244 Martin Luther King jr Way
- 1235 Martin Luther King jr Way
- 1217 Josephine St
- 1223 Josephine St
- 1215 Josephine St
- 1227 Josephine St
- 1211 Josephine St
- 1229 Josephine St
- 1248 Martin Luther King jr Way
- 1239 Martin Luther King jr Way
- 1208 The Alameda
- 1241 Martin Luther King jr Way
- 1233 Josephine St