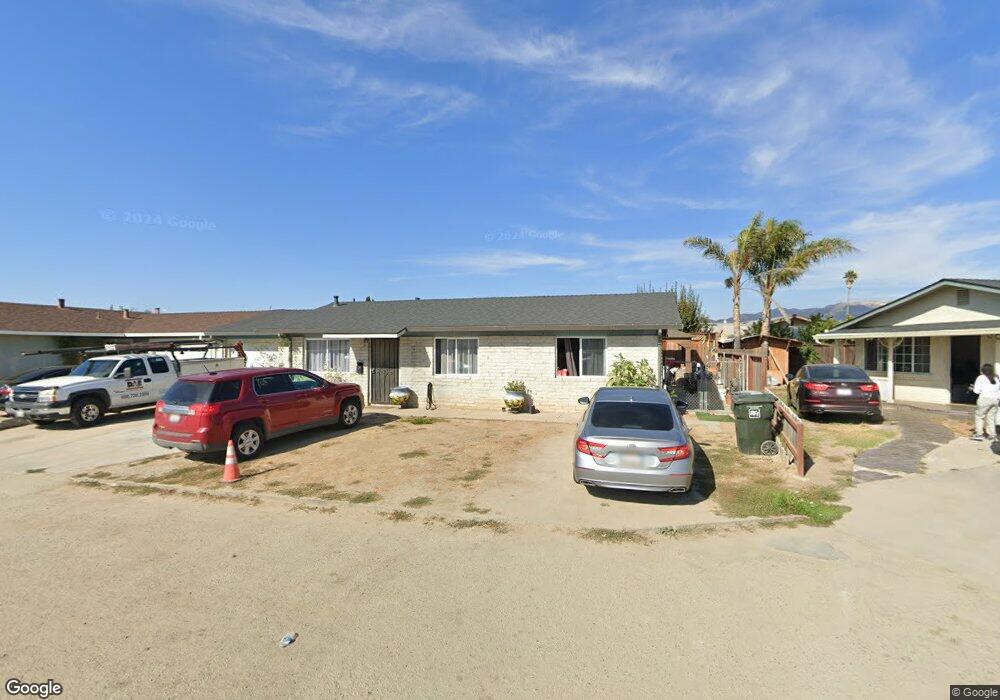
1232 Nogal Dr Salinas, CA 93905
East Salinas NeighborhoodEstimated Value: $516,000 - $603,000
3
Beds
1
Bath
960
Sq Ft
$581/Sq Ft
Est. Value
About This Home
This home is located at 1232 Nogal Dr, Salinas, CA 93905 and is currently estimated at $557,884, approximately $581 per square foot. 1232 Nogal Dr is a home located in Monterey County with nearby schools including Virginia Rocca Barton Elementary School, La Paz Middle School, and Alisal High School.
Ownership History
Date
Name
Owned For
Owner Type
Purchase Details
Closed on
Oct 20, 2020
Sold by
Holdem Investments Lp
Bought by
Vazquez Brian Avila
Current Estimated Value
Home Financials for this Owner
Home Financials are based on the most recent Mortgage that was taken out on this home.
Original Mortgage
$378,510
Outstanding Balance
$336,051
Interest Rate
2.8%
Mortgage Type
FHA
Estimated Equity
$221,833
Purchase Details
Closed on
Nov 1, 2011
Sold by
Yasin Ahmad K
Bought by
Holdem Investments Lp
Purchase Details
Closed on
Jan 24, 2011
Sold by
Gonzalez Victoria and Gonzalez Jose A
Bought by
Yasin Ahmad K
Purchase Details
Closed on
May 3, 2005
Sold by
Gonzalez Victoria
Bought by
Gonzalez Victoria and Gonzalez Jose A
Create a Home Valuation Report for This Property
The Home Valuation Report is an in-depth analysis detailing your home's value as well as a comparison with similar homes in the area
Home Values in the Area
Average Home Value in this Area
Purchase History
| Date | Buyer | Sale Price | Title Company |
|---|---|---|---|
| Vazquez Brian Avila | $409,000 | Chicago Title Company | |
| Holdem Investments Lp | -- | None Available | |
| Holden Management Llc | -- | None Available | |
| Yasin Ahmad K | $94,000 | None Available | |
| Gonzalez Victoria | -- | Stewart Title |
Source: Public Records
Mortgage History
| Date | Status | Borrower | Loan Amount |
|---|---|---|---|
| Open | Vazquez Brian Avila | $378,510 |
Source: Public Records
Tax History Compared to Growth
Tax History
| Year | Tax Paid | Tax Assessment Tax Assessment Total Assessment is a certain percentage of the fair market value that is determined by local assessors to be the total taxable value of land and additions on the property. | Land | Improvement |
|---|---|---|---|---|
| 2025 | $6,571 | $442,713 | $286,844 | $155,869 |
| 2024 | $6,571 | $434,033 | $281,220 | $152,813 |
| 2023 | $5,702 | $425,523 | $275,706 | $149,817 |
| 2022 | $5,406 | $417,180 | $270,300 | $146,880 |
| 2021 | $5,134 | $409,000 | $265,000 | $144,000 |
| 2020 | $1,795 | $140,569 | $58,570 | $81,999 |
| 2019 | $1,850 | $137,814 | $57,422 | $80,392 |
| 2018 | $1,743 | $135,113 | $56,297 | $78,816 |
| 2017 | $1,809 | $132,465 | $55,194 | $77,271 |
| 2016 | $1,716 | $129,868 | $54,112 | $75,756 |
| 2015 | $1,702 | $127,919 | $53,300 | $74,619 |
| 2014 | $1,641 | $125,414 | $52,256 | $73,158 |
Source: Public Records
Map
Nearby Homes
- 742 Pino Way
- 852 Antigua Ave
- 811 Kilbreth Ave
- 1454 Madrone Dr
- 1049 Twin Creeks Dr
- 948 Rider Ave
- 704 Garner Ave Unit 3
- 7 Massachusetts Cir
- 709 Gee St
- 8 Bristol Cir
- 18 Suffield Cir
- 1392 New Hampshire Ct
- 914 Acosta Plaza Unit 91
- 914 Acosta Plaza Unit 111
- 914 Acosta Plaza Unit 94
- 831 Cactus Ct
- 1920 Constitution Blvd Unit 36
- 917 Acosta Plaza Unit 4
- 1615 Newport Ct
- 919 Acosta Plaza Unit 41