Estimated Value: $675,000 - $739,000
4
Beds
3
Baths
2,483
Sq Ft
$288/Sq Ft
Est. Value
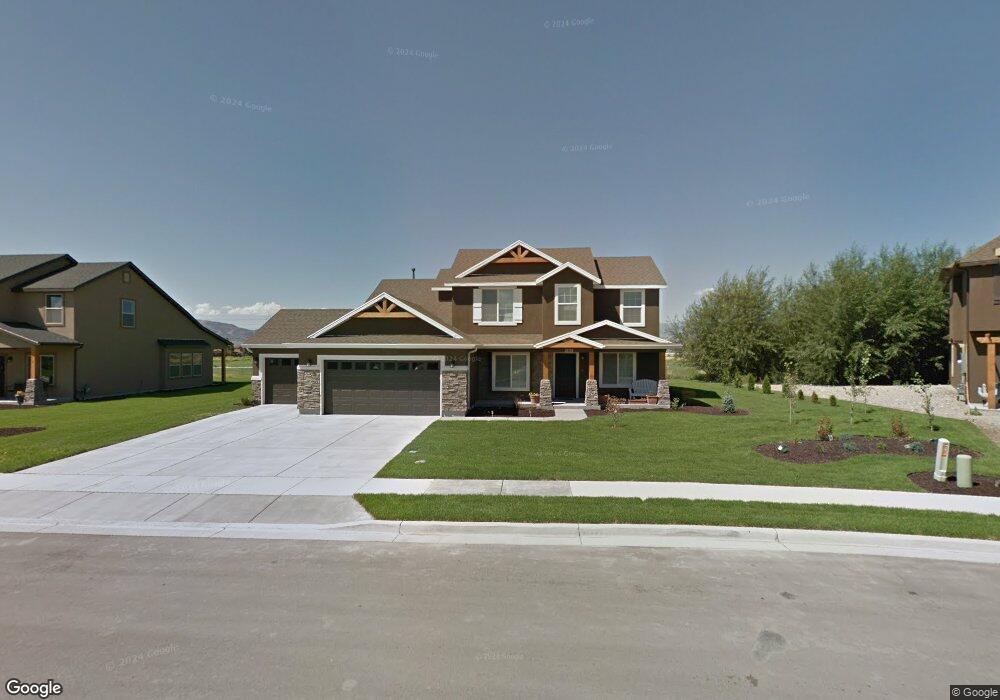
About This Home
This home is located at 1232 S 200 E Unit 7, Lehi, UT 84043 and is currently estimated at $715,003, approximately $287 per square foot. 1232 S 200 E Unit 7 is a home located in Utah County with nearby schools including Dry Creek Elementary School, Lehi Junior High School, and Lehi High School.
Ownership History
Date
Name
Owned For
Owner Type
Purchase Details
Closed on
Oct 25, 2022
Sold by
Babb Mark
Bought by
Mark And Miriam Babb Living Trust
Current Estimated Value
Purchase Details
Closed on
Mar 30, 2012
Sold by
Salisbury Developers Inc
Bought by
Babb Mark and Babb Miriam
Home Financials for this Owner
Home Financials are based on the most recent Mortgage that was taken out on this home.
Original Mortgage
$403,800
Interest Rate
3.85%
Mortgage Type
Construction
Purchase Details
Closed on
Feb 3, 2012
Sold by
Central Bank
Bought by
Salisbury Developers Inc
Home Financials for this Owner
Home Financials are based on the most recent Mortgage that was taken out on this home.
Original Mortgage
$403,800
Interest Rate
3.85%
Mortgage Type
Construction
Purchase Details
Closed on
Dec 24, 2008
Sold by
Lehi Willows Estates Development Llc
Bought by
Central Bank
Create a Home Valuation Report for This Property
The Home Valuation Report is an in-depth analysis detailing your home's value as well as a comparison with similar homes in the area
Home Values in the Area
Average Home Value in this Area
Purchase History
| Date | Buyer | Sale Price | Title Company |
|---|---|---|---|
| Mark And Miriam Babb Living Trust | -- | -- | |
| Babb Mark | -- | None Available | |
| Salisbury Developers Inc | -- | Provo Land Title Company | |
| Central Bank | $3,850,000 | None Available |
Source: Public Records
Mortgage History
| Date | Status | Borrower | Loan Amount |
|---|---|---|---|
| Previous Owner | Salisbury Developers Inc | $403,800 | |
| Closed | Babb Mark | $0 |
Source: Public Records
Tax History
| Year | Tax Paid | Tax Assessment Tax Assessment Total Assessment is a certain percentage of the fair market value that is determined by local assessors to be the total taxable value of land and additions on the property. | Land | Improvement |
|---|---|---|---|---|
| 2025 | $2,894 | $382,470 | -- | -- |
| 2024 | $2,894 | $338,635 | $0 | $0 |
| 2023 | $2,678 | $340,230 | $0 | $0 |
| 2022 | $2,777 | $342,100 | $0 | $0 |
| 2021 | $2,445 | $455,300 | $169,600 | $285,700 |
| 2020 | $2,303 | $424,000 | $157,000 | $267,000 |
| 2019 | $2,058 | $393,900 | $157,000 | $236,900 |
| 2018 | $1,985 | $359,200 | $153,200 | $206,000 |
| 2017 | $1,836 | $176,605 | $0 | $0 |
| 2016 | $1,910 | $170,445 | $0 | $0 |
| 2015 | $1,854 | $157,080 | $0 | $0 |
| 2014 | $1,759 | $148,115 | $0 | $0 |
Source: Public Records
Map
Nearby Homes
- 1250 S 200 E Unit 8
- 1250 S 200 E
- 1233 S 100 E Unit 4
- 179 E 1210 S Unit 6
- 179 E 1210 S
- 1201 S 100 E Unit 3
- 1201 S 100 E Unit 4
- 1268 S 200 E Unit 9
- 1268 S 200 E
- 1257 S 200 E
- 1257 S 200 E Unit 11
- 1237 S 200 E Unit 10
- 1237 S 200 E
- 209 E 1210 S Unit 5
- 209 E 1210 S
- 1277 S 200 E Unit 12
- 229 E 1210 S Unit 4
- 229 E 1210 S
- 1267 S 100 E Unit 3
- 83 E 1230 S Unit 2
Your Personal Tour Guide
Ask me questions while you tour the home.