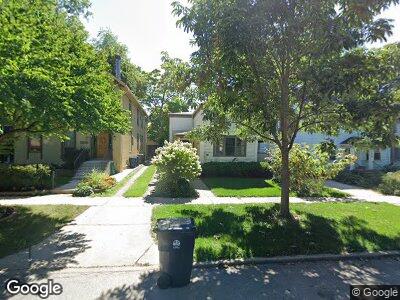
1232 Simpson St Evanston, IL 60201
North Evanston NeighborhoodEstimated Value: $802,325 - $868,000
3
Beds
2
Baths
1,894
Sq Ft
$440/Sq Ft
Est. Value
About This Home
This home is located at 1232 Simpson St, Evanston, IL 60201 and is currently estimated at $833,831, approximately $440 per square foot. 1232 Simpson St is a home located in Cook County with nearby schools including Orrington Elementary School, Haven Middle School, and Evanston Township High School.
Ownership History
Date
Name
Owned For
Owner Type
Purchase Details
Closed on
Nov 12, 2024
Sold by
Dieichans Eric and Goodman Michelle
Bought by
Michelle L Goodman Revocable Trust and Goodman
Current Estimated Value
Purchase Details
Closed on
Oct 21, 1999
Sold by
Bustell Michael W and Kozlark Margaret A
Bought by
Diekhans Eric and Goodman Michelle
Home Financials for this Owner
Home Financials are based on the most recent Mortgage that was taken out on this home.
Original Mortgage
$172,500
Interest Rate
7.87%
Purchase Details
Closed on
Aug 9, 1996
Sold by
Bustell Michael W and Kozlark Margaret A
Bought by
Bustell Michael W and Kozlark Margaret A
Purchase Details
Closed on
Jun 15, 1995
Sold by
Silverstein Charles M and Silverstein Marlene P
Bought by
Bustell Michael W and Kozlark Margaret A
Home Financials for this Owner
Home Financials are based on the most recent Mortgage that was taken out on this home.
Original Mortgage
$203,150
Interest Rate
8.27%
Create a Home Valuation Report for This Property
The Home Valuation Report is an in-depth analysis detailing your home's value as well as a comparison with similar homes in the area
Home Values in the Area
Average Home Value in this Area
Purchase History
| Date | Buyer | Sale Price | Title Company |
|---|---|---|---|
| Michelle L Goodman Revocable Trust | -- | None Listed On Document | |
| Diekhans Eric | $297,500 | -- | |
| Bustell Michael W | -- | -- | |
| Bustell Michael W | $337,500 | 1St American Title |
Source: Public Records
Mortgage History
| Date | Status | Borrower | Loan Amount |
|---|---|---|---|
| Previous Owner | Diekhans Eric H | $100,000 | |
| Previous Owner | Diekhans Eric | $167,200 | |
| Previous Owner | Diekhans Eric | $169,500 | |
| Previous Owner | Diekhans Eric | $172,500 | |
| Previous Owner | Bustell Michael W | $203,150 |
Source: Public Records
Tax History Compared to Growth
Tax History
| Year | Tax Paid | Tax Assessment Tax Assessment Total Assessment is a certain percentage of the fair market value that is determined by local assessors to be the total taxable value of land and additions on the property. | Land | Improvement |
|---|---|---|---|---|
| 2024 | $12,214 | $56,000 | $12,100 | $43,900 |
| 2023 | $12,214 | $56,000 | $12,100 | $43,900 |
| 2022 | $12,214 | $56,000 | $12,100 | $43,900 |
| 2021 | $13,169 | $52,955 | $7,986 | $44,969 |
| 2020 | $13,053 | $52,955 | $7,986 | $44,969 |
| 2019 | $12,771 | $57,938 | $7,986 | $49,952 |
| 2018 | $12,124 | $47,686 | $6,776 | $40,910 |
| 2017 | $12,817 | $51,412 | $6,776 | $44,636 |
| 2016 | $12,379 | $51,412 | $6,776 | $44,636 |
| 2015 | $8,979 | $36,111 | $5,808 | $30,303 |
| 2014 | $8,908 | $36,111 | $5,808 | $30,303 |
| 2013 | $8,688 | $36,111 | $5,808 | $30,303 |
Source: Public Records
Map
Nearby Homes
- 2026 Green Bay Rd
- 1945 Wesley Ave
- 1105 Leonard Place
- 1915 Asbury Ave
- 2024 Maple Ave
- 1909 Asbury Ave
- 2017 Jackson Ave
- 2245 Wesley Ave
- 1833 Asbury Ave
- 1830 Ridge Ave Unit P16
- 1889 Maple Ave Unit E5
- 2025 Sherman Ave Unit 401
- 1862 Sherman Ave Unit 7SE
- 1935 Sherman Ave Unit 2N
- 1935 Sherman Ave Unit 1N
- 1740 Oak Ave Unit 307
- 2256 Sherman Ave Unit 1
- 1864 Sherman Ave Unit 5NW
- 734 Noyes St Unit L1
- 1923 Sherman Ave Unit 1N
- 1232 Simpson St
- 1228 Simpson St
- 1236 Simpson St
- 1226 Simpson St
- 1238 Simpson St
- 2043 Asbury Ave
- 1239 Leon Place
- 2047 Asbury Ave
- 1227 Leon Place
- 1241 Leon Place
- 1220 Simpson St
- 1223 Leon Place
- 1210 Simpson St Unit 3
- 1210 Simpson St Unit 1
- 2102 Asbury Ave
- 2106 Asbury Ave
- 1309 Simpson St
- 2112 Asbury Ave
- 2107 Wesley Ave
- 2122 Asbury Ave