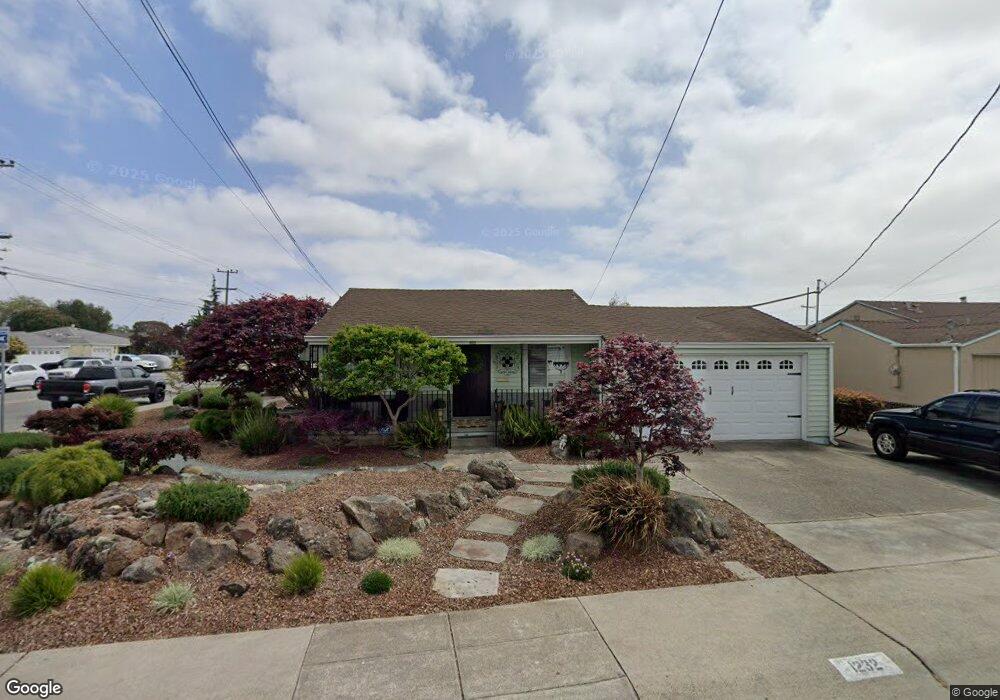
1232 Via Manzanas San Lorenzo, CA 94580
Estimated Value: $807,000 - $879,825
3
Beds
2
Baths
1,250
Sq Ft
$672/Sq Ft
Est. Value
About This Home
This home is located at 1232 Via Manzanas, San Lorenzo, CA 94580 and is currently estimated at $839,456, approximately $671 per square foot. 1232 Via Manzanas is a home located in Alameda County with nearby schools including Del Rey Elementary School, Bohannon Middle School, and Arroyo High School.
Ownership History
Date
Name
Owned For
Owner Type
Purchase Details
Closed on
Apr 4, 2005
Sold by
The Noah Raleigh & Vera Dorothy Tilghman
Bought by
Teran Jose B and Teran Rosa M
Current Estimated Value
Home Financials for this Owner
Home Financials are based on the most recent Mortgage that was taken out on this home.
Original Mortgage
$396,000
Outstanding Balance
$139,620
Interest Rate
1%
Mortgage Type
New Conventional
Estimated Equity
$699,836
Purchase Details
Closed on
Sep 2, 1999
Sold by
Tilghman N R and Tilghman Vera D
Bought by
Tilghman Noah Raleigh and Tilghman Vera Dorothy
Create a Home Valuation Report for This Property
The Home Valuation Report is an in-depth analysis detailing your home's value as well as a comparison with similar homes in the area
Home Values in the Area
Average Home Value in this Area
Purchase History
| Date | Buyer | Sale Price | Title Company |
|---|---|---|---|
| Teran Jose B | $495,000 | Fidelity National Title Co | |
| Tilghman Noah Raleigh | -- | -- |
Source: Public Records
Mortgage History
| Date | Status | Borrower | Loan Amount |
|---|---|---|---|
| Open | Teran Jose B | $396,000 |
Source: Public Records
Tax History Compared to Growth
Tax History
| Year | Tax Paid | Tax Assessment Tax Assessment Total Assessment is a certain percentage of the fair market value that is determined by local assessors to be the total taxable value of land and additions on the property. | Land | Improvement |
|---|---|---|---|---|
| 2025 | $8,742 | $682,920 | $206,976 | $482,944 |
| 2024 | $8,742 | $669,397 | $202,919 | $473,478 |
| 2023 | $8,692 | $663,135 | $198,940 | $464,195 |
| 2022 | $8,569 | $643,137 | $195,041 | $455,096 |
| 2021 | $8,338 | $630,391 | $191,217 | $446,174 |
| 2020 | $8,164 | $630,857 | $189,257 | $441,600 |
| 2019 | $8,182 | $618,491 | $185,547 | $432,944 |
| 2018 | $7,755 | $606,370 | $181,911 | $424,459 |
| 2017 | $7,399 | $594,484 | $178,345 | $416,139 |
| 2016 | $6,234 | $510,000 | $153,000 | $357,000 |
| 2015 | $5,846 | $480,000 | $144,000 | $336,000 |
| 2014 | $5,582 | $455,000 | $136,500 | $318,500 |
Source: Public Records
Map
Nearby Homes
- 1311 Via Manzanas
- 17069 Via Chiquita
- 16050 Via Olinda
- 1575 Via Lucas
- 1338 Via la Paloma
- 1608 Keller Ave
- 15967 Paseo Del Campo
- 16011 Via Conejo
- 17316 Via Flores
- 0 E 14th St Unit 41059501
- 17354 Via el Cerrito
- 17347 Via Encinas
- 1631 Via Ventana
- 1766 Via Redondo
- 1655 Via Escondido
- 18003 Incline Place
- 1867 Via Buena Vista
- 17761 Via Arriba
- 18018 Sahara Rd
- 1781 Via Rancho
- 1260 Via Manzanas
- 17021 Via Chiquita
- 1288 Via Manzanas
- 17029 Via Chiquita
- 1188 Via Manzanas
- 17008 Via Del Rey
- 16199 Via Chiquita
- 17020 Via Chiquita
- 1263 Via Manzanas
- 17018 Via Del Rey
- 17037 Via Chiquita
- 17028 Via Chiquita
- 1287 Via Manzanas
- 1142 Via Manzanas
- 17028 Via Del Rey
- 17036 Via Chiquita
- 17045 Via Chiquita
- 1299 Via Manzanas
- 1163 Via Manzanas
- 17011 Via Margarita