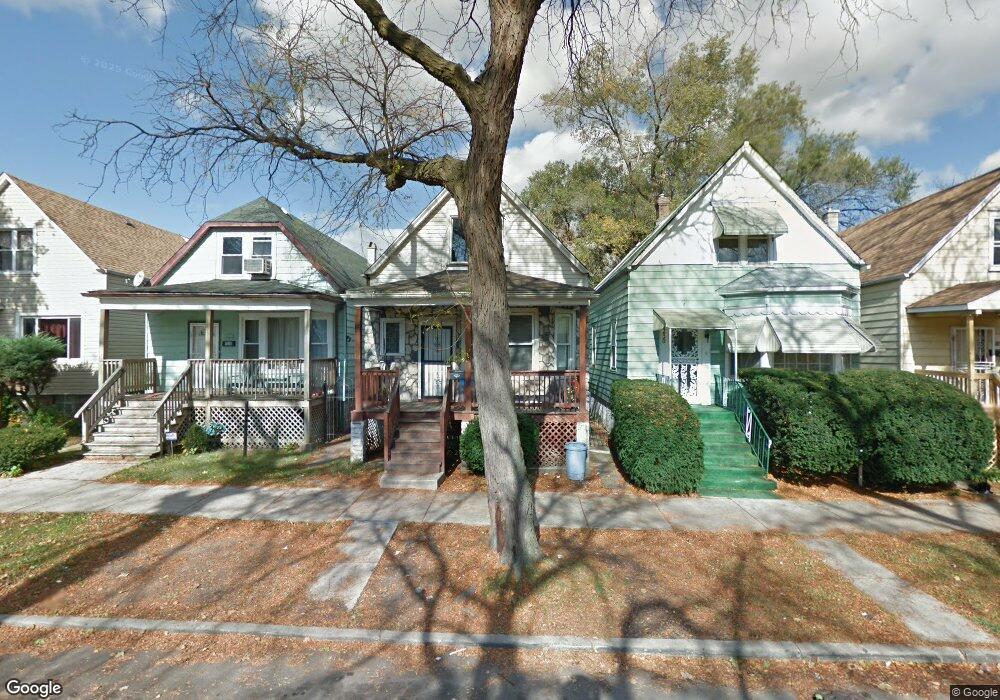
1232 W 71st Place Chicago, IL 60636
Englewood NeighborhoodEstimated Value: $72,000 - $126,000
2
Beds
1
Bath
874
Sq Ft
$122/Sq Ft
Est. Value
About This Home
This home is located at 1232 W 71st Place, Chicago, IL 60636 and is currently estimated at $107,000, approximately $122 per square foot. 1232 W 71st Place is a home located in Cook County with nearby schools including Bond Elementary School and The Montessori School of Englewood Charter School.
Ownership History
Date
Name
Owned For
Owner Type
Purchase Details
Closed on
Sep 9, 2004
Sold by
Mcguire Timothy J
Bought by
Founders Bank
Current Estimated Value
Purchase Details
Closed on
Jul 31, 2003
Sold by
Capital Tax Corp
Bought by
Mcguire Timothy J
Home Financials for this Owner
Home Financials are based on the most recent Mortgage that was taken out on this home.
Original Mortgage
$39,200
Interest Rate
4%
Mortgage Type
Unknown
Purchase Details
Closed on
Feb 13, 2003
Sold by
Moore
Bought by
Tcf Mortgage Corp
Purchase Details
Closed on
Jul 31, 1999
Sold by
Nhs Redevelopment Corp
Bought by
Moore Anthony and Montgomery Patricia
Home Financials for this Owner
Home Financials are based on the most recent Mortgage that was taken out on this home.
Original Mortgage
$60,000
Interest Rate
7.93%
Purchase Details
Closed on
Nov 14, 1997
Sold by
Hud
Bought by
Nhs Redevelopment Corp
Create a Home Valuation Report for This Property
The Home Valuation Report is an in-depth analysis detailing your home's value as well as a comparison with similar homes in the area
Home Values in the Area
Average Home Value in this Area
Purchase History
| Date | Buyer | Sale Price | Title Company |
|---|---|---|---|
| Founders Bank | -- | -- | |
| Mcguire Timothy J | $49,000 | Exeter Title Company | |
| Tcf Mortgage Corp | -- | -- | |
| Moore Anthony | $75,000 | -- | |
| Nhs Redevelopment Corp | -- | -- |
Source: Public Records
Mortgage History
| Date | Status | Borrower | Loan Amount |
|---|---|---|---|
| Previous Owner | Mcguire Timothy J | $39,200 | |
| Previous Owner | Moore Anthony | $60,000 | |
| Closed | Moore Anthony | $16,284 |
Source: Public Records
Tax History Compared to Growth
Tax History
| Year | Tax Paid | Tax Assessment Tax Assessment Total Assessment is a certain percentage of the fair market value that is determined by local assessors to be the total taxable value of land and additions on the property. | Land | Improvement |
|---|---|---|---|---|
| 2024 | $738 | $5,390 | $938 | $4,452 |
| 2023 | $720 | $3,500 | $1,946 | $1,554 |
| 2022 | $720 | $3,500 | $1,946 | $1,554 |
| 2021 | $704 | $3,499 | $1,946 | $1,553 |
| 2020 | $1,129 | $5,066 | $2,343 | $2,723 |
| 2019 | $1,131 | $5,629 | $2,343 | $3,286 |
| 2018 | $1,112 | $5,629 | $2,343 | $3,286 |
| 2017 | $1,702 | $7,905 | $2,031 | $5,874 |
| 2016 | $1,583 | $7,905 | $2,031 | $5,874 |
| 2015 | $1,449 | $7,905 | $2,031 | $5,874 |
| 2014 | $1,345 | $7,251 | $1,875 | $5,376 |
| 2013 | $1,319 | $7,251 | $1,875 | $5,376 |
Source: Public Records
Map
Nearby Homes
- 7041 S Throop St
- 7042 S Racine Ave
- 7050 S Throop St
- 7022 S Elizabeth St
- 7144 S May St
- 7019 S Throop St
- 1241 W 72nd Place
- 7126 S Aberdeen St
- 6953 S Elizabeth St
- 7238 S May St
- 6944 S Racine Ave
- 7151 S Aberdeen St
- 7300 S Racine Ave
- 6946 S May St
- 6943 S Ada St
- 7232 S Aberdeen St
- 7128 S Carpenter St
- 6939 S Ada St
- 6953 S Loomis Blvd
- 1240 W 73rd Place
- 1230 W 71st Place
- 1234 W 71st Place
- 1226 W 71st Place
- 1238 W 71st Place
- 1224 W 71st Place
- 1240 W 71st Place
- 1222 W 71st Place
- 1242 W 71st Place
- 1220 W 71st Place
- 1244 W 71st Place
- 1233 W 71st St
- 1218 W 71st Place Unit 1710
- 1235 W 71st St
- 1246 W 71st Place
- 1241 W 71st St
- 1225 W 71st St
- 1243 W 71st St
- 1223 W 71st St
- 1216 W 71st Place
- 1252 W 71st Place