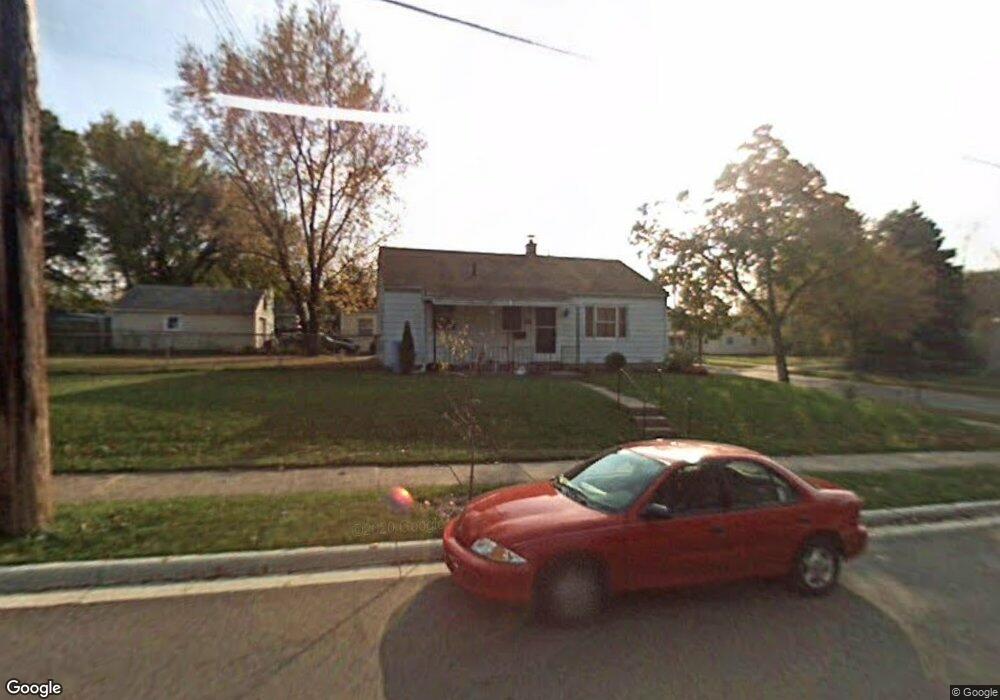
1232 Whyte St Lansing, MI 48906
Northtown NeighborhoodEstimated Value: $103,000 - $118,000
Studio
--
Bath
989
Sq Ft
$111/Sq Ft
Est. Value
About This Home
This home is located at 1232 Whyte St, Lansing, MI 48906 and is currently estimated at $109,664, approximately $110 per square foot. 1232 Whyte St is a home located in Ingham County with nearby schools including Gier Park School, Pattengill Academy, and Eastern High School.
Ownership History
Date
Name
Owned For
Owner Type
Purchase Details
Closed on
Feb 24, 2005
Sold by
Hud
Bought by
Decoster Kathleen and Decoster Kathleen A
Current Estimated Value
Home Financials for this Owner
Home Financials are based on the most recent Mortgage that was taken out on this home.
Original Mortgage
$34,640
Interest Rate
6.05%
Mortgage Type
Fannie Mae Freddie Mac
Purchase Details
Closed on
Jun 22, 2004
Sold by
Mortgage Electronic Registration Systems
Bought by
Hud Of Washington Dc
Purchase Details
Closed on
Mar 18, 2004
Sold by
Hubert Tenell
Bought by
Mortgage Electronic Registration Systems
Purchase Details
Closed on
Dec 5, 2000
Sold by
Lentz Elmer W and Weston Karen
Bought by
Hubert Tenell
Home Financials for this Owner
Home Financials are based on the most recent Mortgage that was taken out on this home.
Original Mortgage
$50,087
Interest Rate
7.8%
Mortgage Type
FHA
Purchase Details
Closed on
Jun 1, 2000
Sold by
Schultz Juanita Jane
Bought by
Lentz Elmer W
Create a Home Valuation Report for This Property
The Home Valuation Report is an in-depth analysis detailing your home's value as well as a comparison with similar homes in the area
Home Values in the Area
Average Home Value in this Area
Purchase History
| Date | Buyer | Sale Price | Title Company |
|---|---|---|---|
| Decoster Kathleen | $58,000 | Tnt | |
| Hud Of Washington Dc | -- | -- | |
| Mortgage Electronic Registration Systems | $56,407 | -- | |
| Hubert Tenell | $50,500 | -- | |
| Lentz Elmer W | -- | First American Title Ins Co |
Source: Public Records
Mortgage History
| Date | Status | Borrower | Loan Amount |
|---|---|---|---|
| Previous Owner | Decoster Kathleen | $34,640 | |
| Previous Owner | Hubert Tenell | $50,087 | |
| Closed | Decoster Kathleen | $29,000 |
Source: Public Records
Tax History
| Year | Tax Paid | Tax Assessment Tax Assessment Total Assessment is a certain percentage of the fair market value that is determined by local assessors to be the total taxable value of land and additions on the property. | Land | Improvement |
|---|---|---|---|---|
| 2025 | $2,410 | $45,300 | $4,700 | $40,600 |
| 2024 | $20 | $38,500 | $4,700 | $33,800 |
| 2023 | $2,269 | $33,400 | $4,700 | $28,700 |
| 2022 | $2,073 | $30,100 | $4,800 | $25,300 |
| 2021 | $2,025 | $30,100 | $7,000 | $23,100 |
| 2020 | $2,011 | $29,000 | $7,000 | $22,000 |
| 2019 | $1,941 | $26,500 | $7,000 | $19,500 |
| 2018 | $1,842 | $23,400 | $7,000 | $16,400 |
| 2017 | $1,772 | $23,400 | $7,000 | $16,400 |
| 2016 | $1,300 | $23,000 | $7,000 | $16,000 |
| 2015 | $1,300 | $22,700 | $14,019 | $8,681 |
| 2014 | $1,300 | $22,400 | $14,019 | $8,381 |
Source: Public Records
Map
Nearby Homes
- 1811 Vermont Ave
- 1613 Massachusetts Ave
- 1017 Whyte St
- 1016 Lake Lansing Rd
- 1810 N High St
- 1522 Illinois Ave
- 0 Lake Lansing Rd Unit 289258
- 1624 N High St
- 1527 Massachusetts Ave
- 1530 New York Ave
- 2112 N High St
- 2318 N High St
- 1317 Illinois Ave
- 1311 Illinois Ave
- 1530 Ballard St
- 1919 N East St
- 1312 Otto St
- 1319 Maryland Ave
- 1323 E César E Chávez Ave
- 1102 Clark St
- 1716 Vermont Ave
- 1804 Vermont Ave
- 1710 Vermont Ave
- 1236 Whyte St
- 1717 Illinois Ave
- 1806 Vermont Ave
- 1801 Illinois Ave
- 1704 Vermont Ave
- 1711 Illinois Ave
- 1220 Whyte St
- 1812 Vermont Ave
- 1223 Whyte St
- 1719 Vermont Ave
- 1711 Vermont Ave
- 1217 Whyte St
- 1705 Illinois Ave
- 1816 Vermont Ave
- 1705 Vermont Ave
- 1210 Whyte St
- 1635 Illinois Ave