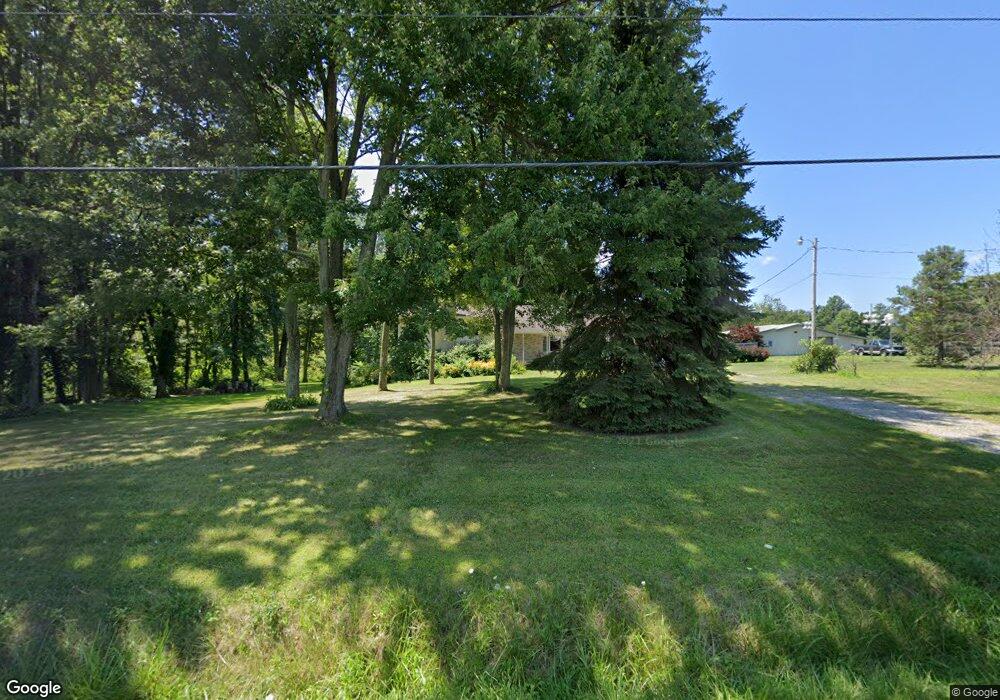
12326 Gore Orphanage Rd Wakeman, OH 44889
Estimated Value: $283,000 - $468,686
3
Beds
2
Baths
2,106
Sq Ft
$169/Sq Ft
Est. Value
About This Home
This home is located at 12326 Gore Orphanage Rd, Wakeman, OH 44889 and is currently estimated at $355,672, approximately $168 per square foot. 12326 Gore Orphanage Rd is a home located in Lorain County with nearby schools including Firelands Elementary School, Firelands Middle School, and Firelands High School.
Ownership History
Date
Name
Owned For
Owner Type
Purchase Details
Closed on
Jul 14, 2017
Sold by
Fogle Adam E
Bought by
Bari Robert F
Current Estimated Value
Purchase Details
Closed on
Oct 21, 2016
Sold by
Bari Robert F
Bought by
Fogle Adam
Home Financials for this Owner
Home Financials are based on the most recent Mortgage that was taken out on this home.
Original Mortgage
$112,000
Interest Rate
3.5%
Mortgage Type
New Conventional
Purchase Details
Closed on
Jul 22, 2016
Sold by
Barl Mary E
Bought by
Bari Robert F
Purchase Details
Closed on
Apr 29, 2002
Sold by
Frank Bari and Frank Arlene C
Bought by
Bari Robert F and Bari Mary E
Home Financials for this Owner
Home Financials are based on the most recent Mortgage that was taken out on this home.
Original Mortgage
$82,000
Interest Rate
7.13%
Create a Home Valuation Report for This Property
The Home Valuation Report is an in-depth analysis detailing your home's value as well as a comparison with similar homes in the area
Home Values in the Area
Average Home Value in this Area
Purchase History
| Date | Buyer | Sale Price | Title Company |
|---|---|---|---|
| Bari Robert F | -- | -- | |
| Fogle Adam | $140,000 | -- | |
| Bari Robert F | -- | -- | |
| Bari Robert F | $80,000 | Midland Title |
Source: Public Records
Mortgage History
| Date | Status | Borrower | Loan Amount |
|---|---|---|---|
| Previous Owner | Fogle Adam | $112,000 | |
| Previous Owner | Bari Robert F | $82,000 | |
| Closed | Bari Robert F | $46,500 |
Source: Public Records
Tax History Compared to Growth
Tax History
| Year | Tax Paid | Tax Assessment Tax Assessment Total Assessment is a certain percentage of the fair market value that is determined by local assessors to be the total taxable value of land and additions on the property. | Land | Improvement |
|---|---|---|---|---|
| 2024 | $5,131 | $117,821 | $35,182 | $82,639 |
| 2023 | $4,712 | $96,401 | $36,432 | $59,969 |
| 2022 | $4,550 | $96,401 | $36,432 | $59,969 |
| 2021 | $4,547 | $96,401 | $36,432 | $59,969 |
| 2020 | $4,120 | $83,250 | $31,460 | $51,790 |
| 2019 | $4,091 | $83,250 | $31,460 | $51,790 |
| 2018 | $4,192 | $83,250 | $31,460 | $51,790 |
| 2017 | $3,524 | $72,190 | $27,560 | $44,630 |
| 2016 | $3,554 | $72,190 | $27,560 | $44,630 |
| 2015 | $3,557 | $72,190 | $27,560 | $44,630 |
| 2014 | $3,426 | $68,310 | $26,080 | $42,230 |
| 2013 | $3,426 | $68,310 | $26,080 | $42,230 |
Source: Public Records
Map
Nearby Homes
- 48304 Ohio 113
- 7218 State Route 60
- 14611 Ohio 113
- 0 Baumhart Rd
- 13514 State Route 113
- 13310 Baumhart Rd
- 41 Court St
- 11135 Baumhart Rd
- Lot B Gifford Rd
- 9839 Gifford Rd
- 9113 Dean Rd
- 15617 Sperry Rd
- 9708 Harrison Rd
- 15806 State Route 511
- 52808 N Ridge Rd
- 5810 U S 20 Unit 72
- 5810 U S 20 Unit 98
- 5810 U S 20 Unit 111
- 5810 U S 20 Unit 3
- 9719 Angling Rd
- 12301 Gore Orphanage Rd
- 12371 Gore Orphanage Rd
- 12220 Gore Orphanage Rd
- 12220 Gore Orphanage Rd
- 12376 Gore Orphanage Rd
- 12541 Gore Orphanage Rd
- 12130 Gore Orphanage Rd
- 12561 Gore Orphanage Rd
- 12619 Gore Orphanage Rd
- 12685 Gore Orphanage Rd
- 12714 Gore Orphanage Rd
- 52761 Ward Rd
- 52681 Ward Rd
- 52701 Ward Rd
- 11959 Gore Orphanage Rd
- 52514 Ward Rd
- 52782 Ward Rd
- 12744 Gore Orphanage Rd
- 11901 Gore Orphanage Rd
- 52464 Ward Rd