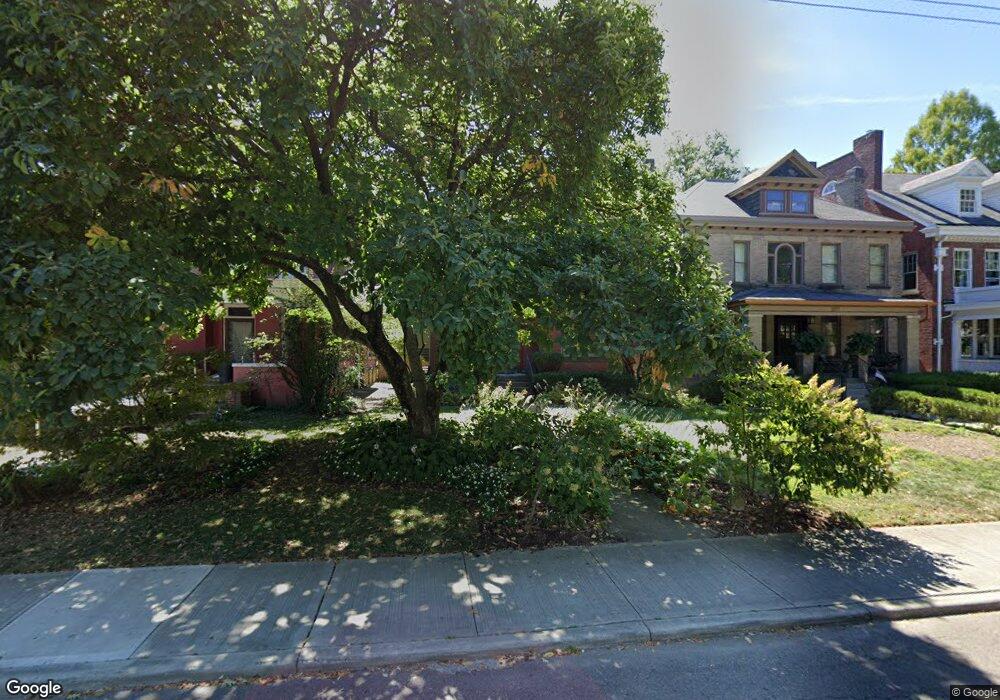
1233 Bryden Rd Columbus, OH 43205
Olde Towne East NeighborhoodEstimated Value: $435,000 - $561,000
4
Beds
2
Baths
2,014
Sq Ft
$239/Sq Ft
Est. Value
About This Home
This home is located at 1233 Bryden Rd, Columbus, OH 43205 and is currently estimated at $480,671, approximately $238 per square foot. 1233 Bryden Rd is a home located in Franklin County with nearby schools including Ohio Avenue Elementary School, Champion Middle School, and East High School.
Ownership History
Date
Name
Owned For
Owner Type
Purchase Details
Closed on
May 27, 2005
Sold by
Voulgaris John A and Smith Stephanie
Bought by
Shank Bradley C and Mutchler Kristin B
Current Estimated Value
Home Financials for this Owner
Home Financials are based on the most recent Mortgage that was taken out on this home.
Original Mortgage
$214,400
Outstanding Balance
$113,008
Interest Rate
5.91%
Mortgage Type
Fannie Mae Freddie Mac
Estimated Equity
$367,663
Purchase Details
Closed on
Oct 3, 2001
Sold by
Holston Timothy L
Bought by
Voulgaris John A and Smith Stephanie
Home Financials for this Owner
Home Financials are based on the most recent Mortgage that was taken out on this home.
Original Mortgage
$213,655
Interest Rate
6.64%
Mortgage Type
Purchase Money Mortgage
Purchase Details
Closed on
Jan 4, 1984
Bought by
Holston Timothy L
Purchase Details
Closed on
Nov 1, 1979
Create a Home Valuation Report for This Property
The Home Valuation Report is an in-depth analysis detailing your home's value as well as a comparison with similar homes in the area
Home Values in the Area
Average Home Value in this Area
Purchase History
| Date | Buyer | Sale Price | Title Company |
|---|---|---|---|
| Shank Bradley C | $268,000 | Amerititle | |
| Voulgaris John A | $224,900 | -- | |
| Holston Timothy L | $64,000 | -- | |
| -- | $46,000 | -- |
Source: Public Records
Mortgage History
| Date | Status | Borrower | Loan Amount |
|---|---|---|---|
| Open | Shank Bradley C | $214,400 | |
| Closed | Voulgaris John A | $213,655 |
Source: Public Records
Tax History Compared to Growth
Tax History
| Year | Tax Paid | Tax Assessment Tax Assessment Total Assessment is a certain percentage of the fair market value that is determined by local assessors to be the total taxable value of land and additions on the property. | Land | Improvement |
|---|---|---|---|---|
| 2024 | $5,412 | $120,580 | $43,930 | $76,650 |
| 2023 | $5,342 | $120,575 | $43,925 | $76,650 |
| 2022 | $4,408 | $84,990 | $7,110 | $77,880 |
| 2021 | $4,416 | $84,990 | $7,110 | $77,880 |
| 2020 | $4,422 | $84,990 | $7,110 | $77,880 |
| 2019 | $4,126 | $68,010 | $5,710 | $62,300 |
| 2018 | $4,392 | $68,010 | $5,710 | $62,300 |
| 2017 | $4,632 | $68,010 | $5,710 | $62,300 |
| 2016 | $5,140 | $77,600 | $5,530 | $72,070 |
| 2015 | $4,666 | $77,600 | $5,530 | $72,070 |
| 2014 | $4,678 | $77,600 | $5,530 | $72,070 |
| 2013 | $2,098 | $70,560 | $5,040 | $65,520 |
Source: Public Records
Map
Nearby Homes
- 1217 Franklin Ave Unit 219
- 1174 E Rich St Unit 1172-1174
- 1179 E Rich St
- 374 Wilson Ave Unit 374-76
- 1029 Franklin Ave
- 1179 Franklin Ave
- 347 Kendall Place
- 838 Bryden Rd
- 1258 Oak St
- 939 E Rich St
- 1469 E Rich St
- 1318 Oak St
- 233 S Ohio Ave Unit 11
- 322-324 S Ohio Ave
- 1084 Bryden Rd Unit 9
- 187 S Ohio Ave
- 185 S Ohio Ave
- 181 S Ohio Ave
- 1095 Franklin Ave
- 1093 Franklin Ave
- 1227 Bryden Rd
- 1237 Bryden Rd
- 1221 Bryden Rd
- 1219 Bryden Rd
- 1251 Bryden Rd
- 303 Wilson Ave Unit 4
- 303 Wilson Ave
- 300 Wilson Ave Unit 298A
- 300 Wilson Ave Unit 300-A
- 1211 Bryden Rd
- 298 Wilson Ave Unit A
- 298 Wilson Ave Unit B
- 298 Wilson Ave Unit 298
- 298 Wilson Ave
- 298-300 Wilson Ave
- 298 Wilson Ave Unit 300
- 307 Wilson Ave Unit 309
- 1205 Bryden Rd Unit 7
- 1267 Bryden Rd
- 1234 Bryden Rd