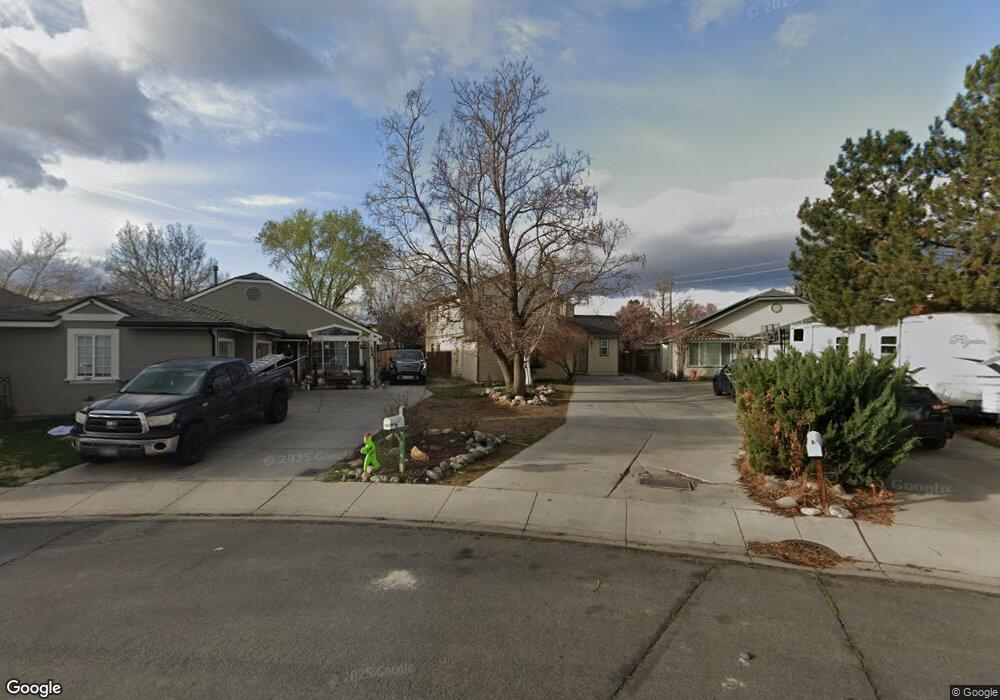
1233 Ian Ct Sparks, NV 89434
O'Callaghan NeighborhoodEstimated Value: $445,000 - $557,265
4
Beds
4
Baths
2,059
Sq Ft
$251/Sq Ft
Est. Value
About This Home
This home is located at 1233 Ian Ct, Sparks, NV 89434 and is currently estimated at $516,816, approximately $251 per square foot. 1233 Ian Ct is a home located in Washoe County with nearby schools including Katherine Dunn Elementary School, George L Dilworth Middle School, and Edward C Reed High School.
Ownership History
Date
Name
Owned For
Owner Type
Purchase Details
Closed on
Jan 10, 2014
Sold by
Dye Edward R and Dye Kelley P
Bought by
Dye Edward R and Dye Kelley P
Current Estimated Value
Home Financials for this Owner
Home Financials are based on the most recent Mortgage that was taken out on this home.
Original Mortgage
$141,500
Outstanding Balance
$107,233
Interest Rate
4.49%
Mortgage Type
New Conventional
Estimated Equity
$409,583
Purchase Details
Closed on
Apr 14, 2010
Sold by
Collier Paul L and Collier Julie T
Bought by
Dye Edward R
Home Financials for this Owner
Home Financials are based on the most recent Mortgage that was taken out on this home.
Original Mortgage
$134,400
Interest Rate
4.95%
Mortgage Type
New Conventional
Purchase Details
Closed on
Dec 16, 2008
Sold by
Collier Julie T and Jensen Julie T
Bought by
Collier Paul L and Collier Julie T
Home Financials for this Owner
Home Financials are based on the most recent Mortgage that was taken out on this home.
Original Mortgage
$178,062
Interest Rate
5.97%
Mortgage Type
FHA
Purchase Details
Closed on
May 1, 1998
Sold by
Rsw Development Inc
Bought by
Jensen Julie T
Home Financials for this Owner
Home Financials are based on the most recent Mortgage that was taken out on this home.
Original Mortgage
$122,600
Interest Rate
9%
Create a Home Valuation Report for This Property
The Home Valuation Report is an in-depth analysis detailing your home's value as well as a comparison with similar homes in the area
Home Values in the Area
Average Home Value in this Area
Purchase History
| Date | Buyer | Sale Price | Title Company |
|---|---|---|---|
| Dye Edward R | -- | Servicelink | |
| Dye Edward R | $168,000 | First American Title Reno | |
| Collier Paul L | -- | First American | |
| Jensen Julie T | $163,500 | Founders Title Co |
Source: Public Records
Mortgage History
| Date | Status | Borrower | Loan Amount |
|---|---|---|---|
| Open | Dye Edward R | $141,500 | |
| Closed | Dye Edward R | $134,400 | |
| Previous Owner | Collier Paul L | $178,062 | |
| Previous Owner | Jensen Julie T | $122,600 |
Source: Public Records
Tax History Compared to Growth
Tax History
| Year | Tax Paid | Tax Assessment Tax Assessment Total Assessment is a certain percentage of the fair market value that is determined by local assessors to be the total taxable value of land and additions on the property. | Land | Improvement |
|---|---|---|---|---|
| 2025 | $3,368 | $112,157 | $34,580 | $77,577 |
| 2024 | $3,368 | $111,166 | $32,725 | $78,441 |
| 2023 | $3,119 | $106,456 | $32,305 | $74,151 |
| 2022 | $2,889 | $87,982 | $26,005 | $61,977 |
| 2021 | $2,676 | $81,625 | $19,845 | $61,780 |
| 2020 | $2,596 | $81,739 | $19,775 | $61,964 |
| 2019 | $2,521 | $78,881 | $18,935 | $59,946 |
| 2018 | $2,447 | $72,727 | $13,965 | $58,762 |
| 2017 | $2,376 | $71,618 | $12,670 | $58,948 |
| 2016 | $2,316 | $71,670 | $11,410 | $60,260 |
| 2015 | $2,311 | $69,748 | $9,625 | $60,123 |
| 2014 | $2,244 | $66,028 | $8,225 | $57,803 |
| 2013 | -- | $60,093 | $6,090 | $54,003 |
Source: Public Records
Map
Nearby Homes
- 1544 Woodhaven Ln
- 1218 Junction Dr
- 1728 Bluehaven Dr
- 1332 Coachman Ct
- 1897 Bonita Vista Dr
- 1970 Woodhaven Ln
- 1990 Fargo Way
- 1973 Rio Tinto Dr
- 857 Cherry Tree Dr Unit 3
- 949 Crestwood Dr Unit 3
- 1770 Burnside Dr
- 801 Woodglen Dr Unit 2
- 848 Parkside Dr Unit 1
- 1051 Glen Martin Dr
- 2435 Sycamore Glen Dr Unit 2
- 675 Parlanti Ln Unit 52
- 675 Parlanti Ln Unit 124
- 675 Parlanti Ln Unit 42
- 675 Parlanti Ln
- 675 Parlanti Ln Unit 88