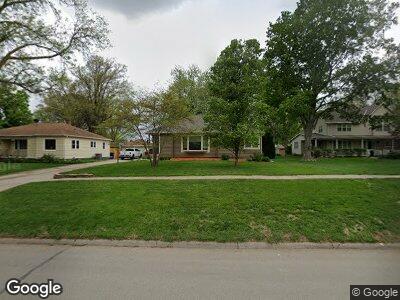
1233 Midland St Syracuse, NE 68446
Estimated Value: $189,000 - $238,000
3
Beds
2
Baths
1,329
Sq Ft
$161/Sq Ft
Est. Value
About This Home
This home is located at 1233 Midland St, Syracuse, NE 68446 and is currently estimated at $214,407, approximately $161 per square foot. 1233 Midland St is a home located in Otoe County with nearby schools including Elementary School at Syracuse and High School at Syracuse.
Ownership History
Date
Name
Owned For
Owner Type
Purchase Details
Closed on
Dec 1, 2023
Sold by
Shanks Ray and Shanks Nancy Marie
Bought by
Shanks Ray and Shanks Nancy Marie
Current Estimated Value
Purchase Details
Closed on
Aug 19, 2021
Sold by
Edwin Higgins Ollie
Bought by
Shanks Ray
Purchase Details
Closed on
Aug 12, 2011
Sold by
Mulcahy Paul F and Mulcahy Cynthia L
Bought by
Higgins Ollie Edwin
Home Financials for this Owner
Home Financials are based on the most recent Mortgage that was taken out on this home.
Original Mortgage
$114,000
Interest Rate
4.53%
Mortgage Type
New Conventional
Create a Home Valuation Report for This Property
The Home Valuation Report is an in-depth analysis detailing your home's value as well as a comparison with similar homes in the area
Home Values in the Area
Average Home Value in this Area
Purchase History
| Date | Buyer | Sale Price | Title Company |
|---|---|---|---|
| Shanks Ray | -- | Nebraska Title | |
| Shanks Ray | -- | Charter Title | |
| Higgins Ollie Edwin | $109,900 | None Available |
Source: Public Records
Mortgage History
| Date | Status | Borrower | Loan Amount |
|---|---|---|---|
| Previous Owner | Higgins Ollie Edwin | $114,000 |
Source: Public Records
Tax History Compared to Growth
Tax History
| Year | Tax Paid | Tax Assessment Tax Assessment Total Assessment is a certain percentage of the fair market value that is determined by local assessors to be the total taxable value of land and additions on the property. | Land | Improvement |
|---|---|---|---|---|
| 2024 | $3,018 | $154,720 | $6,970 | $147,750 |
| 2023 | $2,988 | $154,720 | $6,970 | $147,750 |
| 2022 | $2,403 | $125,170 | $6,970 | $118,200 |
| 2021 | $1,980 | $105,470 | $6,970 | $98,500 |
| 2020 | $1,871 | $98,180 | $6,970 | $91,210 |
| 2019 | $1,890 | $98,180 | $6,970 | $91,210 |
| 2018 | $1,807 | $98,180 | $6,970 | $91,210 |
| 2017 | $1,614 | $89,970 | $5,660 | $84,310 |
| 2016 | $1,612 | $89,970 | $5,660 | $84,310 |
| 2015 | $1,624 | $89,950 | $5,640 | $84,310 |
| 2014 | $1,724 | $89,950 | $5,640 | $84,310 |
| 2012 | $1,748 | $89,950 | $5,640 | $84,310 |
Source: Public Records
Map
Nearby Homes