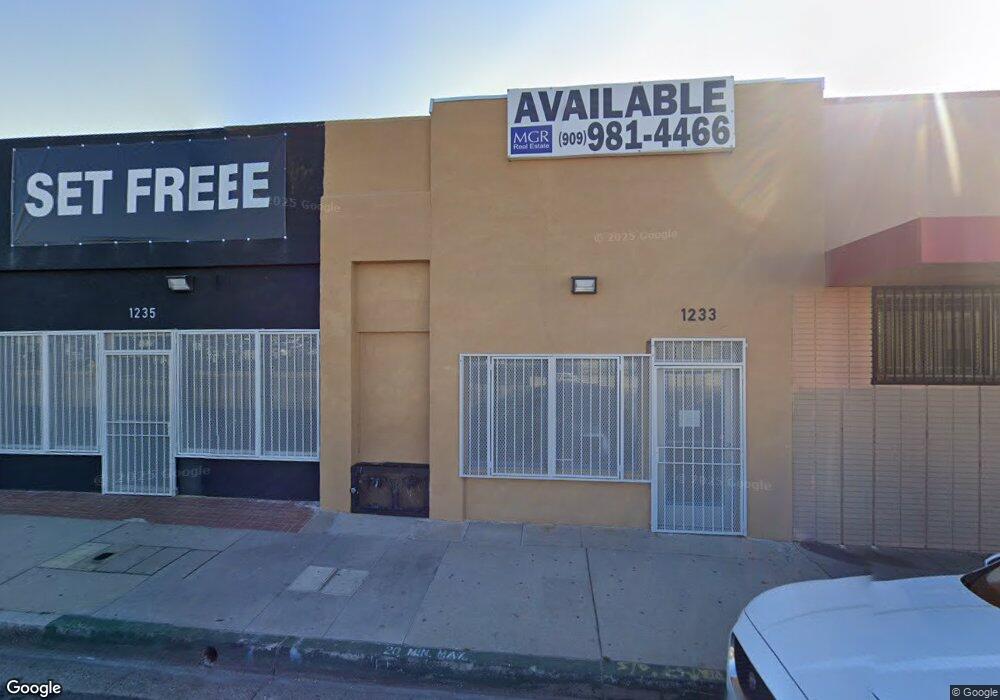
1233 N E St San Bernardino, CA 92405
SBHS NeighborhoodEstimated Value: $358,073
--
Bed
--
Bath
3,948
Sq Ft
$91/Sq Ft
Est. Value
About This Home
This home is located at 1233 N E St, San Bernardino, CA 92405 and is currently estimated at $358,073, approximately $90 per square foot. 1233 N E St is a home located in San Bernardino County with nearby schools including Lincoln Elementary School, Arrowview Middle School, and San Bernardino High School.
Ownership History
Date
Name
Owned For
Owner Type
Purchase Details
Closed on
Sep 28, 2022
Sold by
Garcia Julio and Garcia Brittany Michelle
Bought by
Garcia Julio
Current Estimated Value
Purchase Details
Closed on
Oct 25, 2017
Sold by
Regent Capital Investments Llc
Bought by
Garcia Julio and Webb Brittany Michelle
Home Financials for this Owner
Home Financials are based on the most recent Mortgage that was taken out on this home.
Original Mortgage
$100,000
Interest Rate
3.83%
Mortgage Type
Purchase Money Mortgage
Purchase Details
Closed on
Dec 9, 2011
Sold by
Awad Mohammad Abdelmajid and Awad Muhammad A
Bought by
Regent Capital Investments Llc
Purchase Details
Closed on
Apr 11, 2006
Sold by
Estate Of Elizabeth Joseph
Bought by
Awad Muhammad A
Purchase Details
Closed on
Apr 2, 2006
Sold by
Awad Sumaya A
Bought by
Awad Muhammad A
Create a Home Valuation Report for This Property
The Home Valuation Report is an in-depth analysis detailing your home's value as well as a comparison with similar homes in the area
Home Values in the Area
Average Home Value in this Area
Purchase History
| Date | Buyer | Sale Price | Title Company |
|---|---|---|---|
| Garcia Julio | -- | -- | |
| Garcia Julio | $186,000 | Fidelity | |
| Regent Capital Investments Llc | $228,700 | Chicago Title Co | |
| Awad Muhammad A | $350,000 | Ticor Title Company | |
| Awad Muhammad A | -- | Ticor Title Company |
Source: Public Records
Mortgage History
| Date | Status | Borrower | Loan Amount |
|---|---|---|---|
| Previous Owner | Garcia Julio | $100,000 |
Source: Public Records
Tax History Compared to Growth
Tax History
| Year | Tax Paid | Tax Assessment Tax Assessment Total Assessment is a certain percentage of the fair market value that is determined by local assessors to be the total taxable value of land and additions on the property. | Land | Improvement |
|---|---|---|---|---|
| 2025 | $2,761 | $211,636 | $64,000 | $147,636 |
| 2024 | $2,761 | $207,486 | $62,745 | $144,741 |
| 2023 | $2,692 | $203,418 | $61,515 | $141,903 |
| 2022 | $2,695 | $199,430 | $60,309 | $139,121 |
| 2021 | $2,699 | $195,519 | $59,126 | $136,393 |
| 2020 | $2,704 | $193,514 | $58,520 | $134,994 |
| 2019 | $2,626 | $189,720 | $57,373 | $132,347 |
| 2018 | $4,435 | $326,758 | $38,638 | $288,120 |
| 2017 | $4,298 | $320,351 | $37,880 | $282,471 |
| 2016 | $4,169 | $314,069 | $37,137 | $276,932 |
| 2015 | $4,097 | $309,351 | $36,579 | $272,772 |
| 2014 | $3,983 | $303,291 | $35,862 | $267,429 |
Source: Public Records
Map
Nearby Homes
- 1305 N D St
- 1330 Acacia Ave
- 1346 N D St
- 381 W Wabash St
- 1372 N E St
- 1137 N Mayfield Ave
- 1064 Acacia Ave
- 464 W 14th St
- 1323 N G St
- 636 W Olive St
- 642 W Olive St
- 664 W 14th St
- 1391 N Crescent Ave
- 1572 N Stoddard Ave
- 1525 N Arrowhead Ave
- 977 N G St
- 156 W Wabash St
- 928 N Arrowhead Ave
- 1550 N Pershing Ave
- 591 W 9th St
- 1243 N G St
- 1243 N E St
- 1251 N E
- 1255 N E St
- 1245 N E St
- 1244 N Stoddard Ave
- 1261 N E St
- 1261 N G St
- 1261 N E
- 1256 N Stoddard Ave
- 478 W Base Line St
- 1246 N Stoddard Ave
- 1246 Stoddard Ave
- 456 W Base Line St
- 456 Baseline Ave W
- 1268 N Stoddard Ave
- 1278 N Stoddard Ave
- 1237 N Stoddard Ave
- 1241 N Stoddard Ave
- 1221 N Stoddard Ave