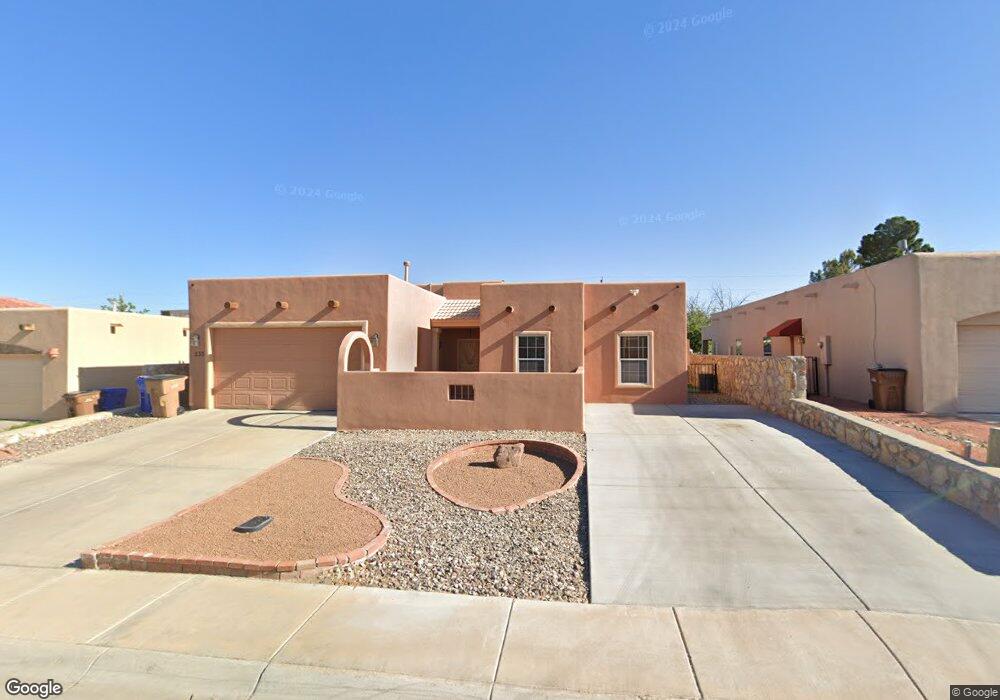
1233 Osage Ct Las Cruces, NM 88005
Estimated Value: $249,960 - $301,000
3
Beds
2
Baths
1,401
Sq Ft
$197/Sq Ft
Est. Value
About This Home
This home is located at 1233 Osage Ct, Las Cruces, NM 88005 and is currently estimated at $275,480, approximately $196 per square foot. 1233 Osage Ct is a home located in Dona Ana County with nearby schools including Jornada Elementary School, Vista Middle School, and Centennial High School.
Ownership History
Date
Name
Owned For
Owner Type
Purchase Details
Closed on
Jul 30, 2018
Sold by
Perez Caleb T and Perez Diana L
Bought by
Perez Caleb T
Current Estimated Value
Home Financials for this Owner
Home Financials are based on the most recent Mortgage that was taken out on this home.
Original Mortgage
$120,750
Outstanding Balance
$104,866
Interest Rate
4.5%
Mortgage Type
New Conventional
Estimated Equity
$170,614
Purchase Details
Closed on
Oct 20, 2011
Sold by
The Property Tax Division Of The Taxatio
Bought by
Caleb Perez
Purchase Details
Closed on
Dec 16, 2005
Sold by
R Builders Inc
Bought by
Halverson Marty
Purchase Details
Closed on
Jul 25, 2005
Sold by
Aed Inc
Bought by
R Builders Inc
Home Financials for this Owner
Home Financials are based on the most recent Mortgage that was taken out on this home.
Original Mortgage
$111,375
Interest Rate
5.61%
Mortgage Type
Construction
Create a Home Valuation Report for This Property
The Home Valuation Report is an in-depth analysis detailing your home's value as well as a comparison with similar homes in the area
Home Values in the Area
Average Home Value in this Area
Purchase History
| Date | Buyer | Sale Price | Title Company |
|---|---|---|---|
| Perez Caleb T | -- | Dona Ana Title Company | |
| Caleb Perez | -- | None Available | |
| Halverson Marty | -- | Southwestern Abstract & Titl | |
| R Builders Inc | -- | Southwestern Abstract & Titl |
Source: Public Records
Mortgage History
| Date | Status | Borrower | Loan Amount |
|---|---|---|---|
| Open | Perez Caleb T | $120,750 | |
| Previous Owner | R Builders Inc | $111,375 |
Source: Public Records
Tax History Compared to Growth
Tax History
| Year | Tax Paid | Tax Assessment Tax Assessment Total Assessment is a certain percentage of the fair market value that is determined by local assessors to be the total taxable value of land and additions on the property. | Land | Improvement |
|---|---|---|---|---|
| 2024 | $1,495 | $49,070 | $10,173 | $38,897 |
| 2023 | $1,473 | $47,641 | $9,983 | $37,658 |
| 2022 | $1,451 | $46,254 | $9,783 | $36,471 |
| 2021 | $1,404 | $44,907 | $9,589 | $35,318 |
| 2020 | $1,370 | $43,600 | $9,401 | $34,199 |
| 2019 | $1,334 | $42,330 | $9,218 | $33,112 |
| 2018 | $1,287 | $41,097 | $9,040 | $32,057 |
| 2017 | $1,147 | $39,900 | $8,867 | $31,033 |
| 2016 | $1,162 | $39,900 | $8,867 | $31,033 |
| 2015 | $1,168 | $119,686 | $26,574 | $93,112 |
| 2014 | $1,134 | $116,200 | $25,800 | $90,400 |
Source: Public Records
Map
Nearby Homes
- 3523 Omaha Ct
- 3522 Omaha Ct
- 3435 Elkridge Ln
- 3387 Elkridge Ln
- 1109 Hermosillo Dr
- 1422 Lenox Ave
- 4052 Gila Trail
- 4008 Lasso Loop
- 4020 Lasso Loop
- 4038 Lasso Loop
- 4056 Lasso Loop
- 1055 Jasmine Dr
- 4004 Elks Dr
- 1009 Ferndale Dr
- 4165 Mojave Dr
- 952 Glendale Dr
- TBD Conocito Place
- 1534 Lenox Ave
- 1014 Cedardale Dr
- 1002 Devendale Ave
- 1237 Osage Ct
- 1229 Osage Ct
- 1225 Osage Ct
- 1241 Osage Ct
- 1212 Edgewood Ave
- 1214 Edgewood Ave
- 1230 Osage Ct
- 1210 Edgewood Ave
- 1245 Osage Ct
- 1221 Osage Ct
- 1216 Edgewood Ave
- 1240 Osage Ct
- 3529 Omaha Ct
- 1208 Edgewood Ave
- 3526 Ottawa Ct
- 1220 Osage Ct
- 3539 Ottawa Ct
- 1249 Osage Ct
- 1217 Osage Ct
- 3531 Ottawa Ct