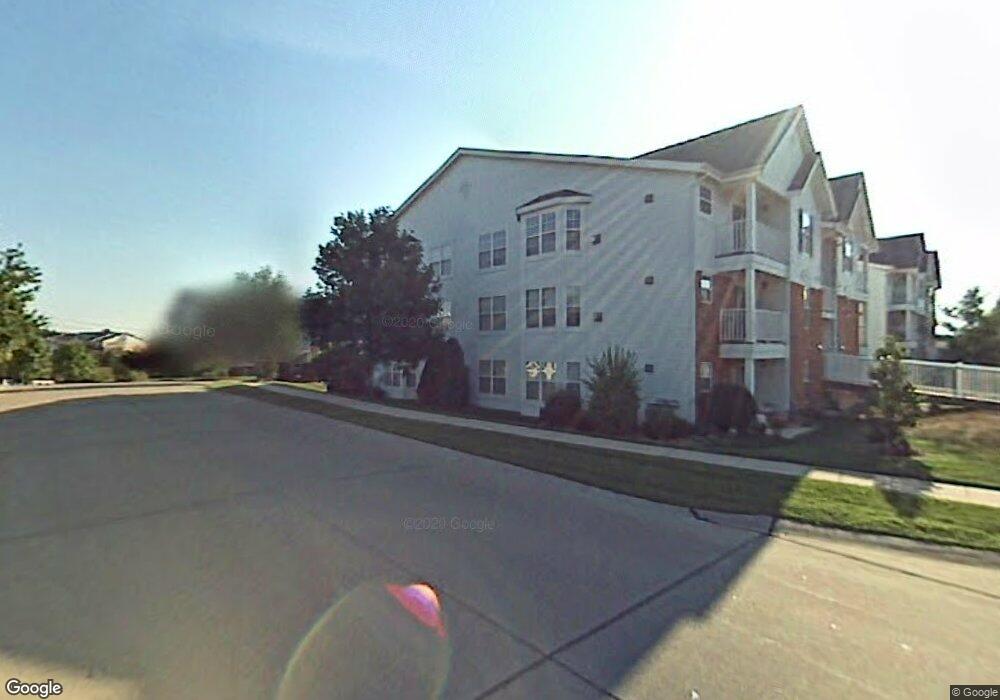
1233 Woodland Point Dr Unit H Saint Louis, MO 63146
Estimated Value: $171,000 - $179,000
2
Beds
2
Baths
1,050
Sq Ft
$167/Sq Ft
Est. Value
About This Home
This home is located at 1233 Woodland Point Dr Unit H, Saint Louis, MO 63146 and is currently estimated at $175,478, approximately $167 per square foot. 1233 Woodland Point Dr Unit H is a home located in St. Louis County with nearby schools including River Bend Elementary School, Parkway Central Middle School, and Parkway Central High School.
Ownership History
Date
Name
Owned For
Owner Type
Purchase Details
Closed on
Oct 22, 2004
Sold by
Xue Guo Guang and Liang Shao Er
Bought by
Garnett Financial Lp
Current Estimated Value
Purchase Details
Closed on
Oct 26, 2000
Sold by
Lim We and Lim Kann
Bought by
Xue Guo Guang and Liang Shao Er
Home Financials for this Owner
Home Financials are based on the most recent Mortgage that was taken out on this home.
Original Mortgage
$92,000
Interest Rate
7.87%
Purchase Details
Closed on
Jun 23, 2000
Sold by
Hopkins Deborah R
Bought by
Lim We and Lim Kann
Home Financials for this Owner
Home Financials are based on the most recent Mortgage that was taken out on this home.
Original Mortgage
$81,200
Interest Rate
8.66%
Purchase Details
Closed on
Nov 21, 1997
Sold by
Taylor Morley Inc
Bought by
Hopkins Deborah R
Home Financials for this Owner
Home Financials are based on the most recent Mortgage that was taken out on this home.
Original Mortgage
$99,200
Interest Rate
7.3%
Mortgage Type
FHA
Create a Home Valuation Report for This Property
The Home Valuation Report is an in-depth analysis detailing your home's value as well as a comparison with similar homes in the area
Home Values in the Area
Average Home Value in this Area
Purchase History
| Date | Buyer | Sale Price | Title Company |
|---|---|---|---|
| Garnett Financial Lp | $138,000 | -- | |
| Xue Guo Guang | -- | -- | |
| Lim We | $116,000 | -- | |
| Hopkins Deborah R | -- | -- |
Source: Public Records
Mortgage History
| Date | Status | Borrower | Loan Amount |
|---|---|---|---|
| Previous Owner | Xue Guo Guang | $92,000 | |
| Previous Owner | Lim We | $81,200 | |
| Previous Owner | Hopkins Deborah R | $99,200 |
Source: Public Records
Tax History Compared to Growth
Tax History
| Year | Tax Paid | Tax Assessment Tax Assessment Total Assessment is a certain percentage of the fair market value that is determined by local assessors to be the total taxable value of land and additions on the property. | Land | Improvement |
|---|---|---|---|---|
| 2025 | $1,939 | $30,820 | $9,580 | $21,240 |
| 2024 | $1,939 | $29,050 | $5,000 | $24,050 |
| 2023 | $1,861 | $29,050 | $5,000 | $24,050 |
| 2022 | $1,704 | $24,170 | $7,180 | $16,990 |
| 2021 | $1,697 | $24,170 | $7,180 | $16,990 |
| 2020 | $1,603 | $21,910 | $5,990 | $15,920 |
| 2019 | $1,568 | $21,910 | $5,990 | $15,920 |
| 2018 | $1,456 | $18,830 | $2,790 | $16,040 |
| 2017 | $1,416 | $18,830 | $2,790 | $16,040 |
| 2016 | $1,427 | $18,030 | $3,990 | $14,040 |
| 2015 | $1,495 | $18,030 | $3,990 | $14,040 |
| 2014 | $1,387 | $17,940 | $5,190 | $12,750 |
Source: Public Records
Map
Nearby Homes
- 1324 Golden Point Dr
- 13101 Mill Crossing Ct Unit 302
- 13101 Mill Crossing Ct Unit 306
- 1163 Mill Crossing Dr Unit 103
- 13136 Oldfarm Dr
- 13041 Tiger Lily Ct Unit 10
- 12917 Portulaca Dr Unit 225
- 12929 Portulaca Dr Unit 310
- 12924 Autumn View Dr
- 1239 Creve Coeur Crossing Ln Unit C
- 1444 Nancy Lee Dr
- 13104 Fourposter Ct
- 940 Fernview Dr
- 12964 Autumn View Dr
- 12930 Ferntop Ln
- 12812 Portulaca Dr Unit K
- 1150 Rue La Chelle Walk Unit 1150
- 13033 King Arthur Spur
- 925 Maison Ladue Dr
- 809 Aramis Dr
- 1233 Woodland Point Dr Unit C
- 1233 Woodland Point Dr Unit J
- 1233 Woodland Point Dr Unit K
- 1233 Woodland Point Dr Unit F
- 1233 Woodland Point Dr Unit L
- 1233 Woodland Point Dr Unit D
- 1233 Woodland Point Dr Unit A
- 1233 Woodland Point Dr Unit E
- 1233 Woodland Point Dr Unit G
- 1233 Woodland Point Dr Unit B
- 1225 Woodland Point Dr Unit E
- 1225 Woodland Point Dr Unit A
- 1225 Woodland Point Dr Unit J
- 1225 Woodland Point Dr Unit I
- 1225 Woodland Point Dr Unit B
- 1225 Woodland Point Dr Unit F
- 1225 Woodland Point Dr Unit D
- 1225 Woodland Point Dr Unit K
- 1225 Woodland Point Dr Unit H
- 13126 Hickory Mill Ct