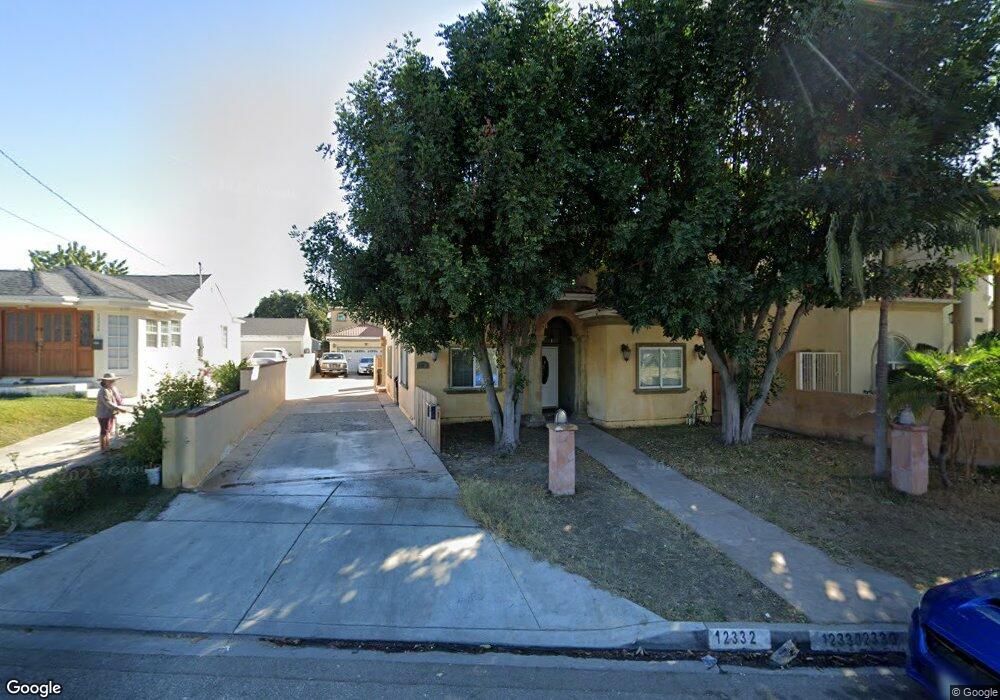
12330 Orizaba Ave Downey, CA 90242
Estimated Value: $1,755,000 - $2,237,513
10
Beds
8
Baths
5,924
Sq Ft
$336/Sq Ft
Est. Value
About This Home
This home is located at 12330 Orizaba Ave, Downey, CA 90242 and is currently estimated at $1,988,628, approximately $335 per square foot. 12330 Orizaba Ave is a home located in Los Angeles County with nearby schools including Imperial Elementary School, Old River Elementary School, and West Middle School.
Ownership History
Date
Name
Owned For
Owner Type
Purchase Details
Closed on
Sep 13, 2007
Sold by
Carrillo Saul
Bought by
Carrillo Saul and Kampa Rolf
Current Estimated Value
Purchase Details
Closed on
Sep 19, 2005
Sold by
Liv Mccabe Michael J and Liv Michael J Mccabe Revocable
Bought by
Carrillo Saul
Purchase Details
Closed on
Jan 14, 2005
Sold by
Mccabe Michael J
Bought by
Liv Mccabe Michael J and Liv Michael J Mccabe Revocable
Home Financials for this Owner
Home Financials are based on the most recent Mortgage that was taken out on this home.
Original Mortgage
$376,000
Interest Rate
5.65%
Mortgage Type
Purchase Money Mortgage
Purchase Details
Closed on
Nov 24, 2004
Sold by
Raasch Dale Lloyd
Bought by
Mccabe Michael J
Home Financials for this Owner
Home Financials are based on the most recent Mortgage that was taken out on this home.
Original Mortgage
$376,000
Interest Rate
5.65%
Mortgage Type
Purchase Money Mortgage
Create a Home Valuation Report for This Property
The Home Valuation Report is an in-depth analysis detailing your home's value as well as a comparison with similar homes in the area
Purchase History
| Date | Buyer | Sale Price | Title Company |
|---|---|---|---|
| Carrillo Saul | -- | None Available | |
| Carrillo Saul | -- | -- | |
| Liv Mccabe Michael J | -- | -- | |
| Mccabe Michael J | $470,000 | United Title Company |
Source: Public Records
Mortgage History
| Date | Status | Borrower | Loan Amount |
|---|---|---|---|
| Previous Owner | Mccabe Michael J | $376,000 | |
| Closed | Mccabe Michael J | $94,000 |
Source: Public Records
Tax History
| Year | Tax Paid | Tax Assessment Tax Assessment Total Assessment is a certain percentage of the fair market value that is determined by local assessors to be the total taxable value of land and additions on the property. | Land | Improvement |
|---|---|---|---|---|
| 2025 | $22,330 | $1,815,474 | $725,649 | $1,089,825 |
| 2024 | $22,330 | $1,779,877 | $711,421 | $1,068,456 |
| 2023 | $21,561 | $1,744,978 | $697,472 | $1,047,506 |
| 2022 | $20,467 | $1,710,764 | $683,797 | $1,026,967 |
| 2021 | $20,041 | $1,677,221 | $670,390 | $1,006,831 |
| 2020 | $19,732 | $1,660,024 | $663,516 | $996,508 |
| 2019 | $19,526 | $1,627,475 | $650,506 | $976,969 |
| 2018 | $19,022 | $1,595,564 | $637,751 | $957,813 |
| 2016 | $18,455 | $1,533,609 | $612,988 | $920,621 |
| 2015 | $18,199 | $1,510,574 | $603,781 | $906,793 |
| 2014 | $17,135 | $1,480,985 | $591,954 | $889,031 |
Source: Public Records
Map
Nearby Homes
- 8264 Lankin St
- 12325 Glynn Ave
- 0 Orange St
- 8324 Alameda St
- 12143 Downey Ave
- 12135 Downey Ave
- 12636 Glynn Ave
- 7820 Springer St
- 12738 Gurley Ave
- 12363 Birchdale Ave
- 8516 Lyndora St
- 8254 Stewart And Gray Rd
- 8312 Devenir Ave
- 8041 Puritan St
- 8701 Boyne St
- 8333 Puritan St
- 12152 Marbel Ave
- 12148 Marbel Ave
- 8139 Priscilla St
- 13000 Paramount Blvd
- 12324 Orizaba Ave
- 12334 Orizaba Ave
- 12318 Orizaba Ave
- 12340 Orizaba Ave
- 12359 Gneiss Ave
- 12353 Gneiss Ave
- 12312 Orizaba Ave
- 12363 Gneiss Ave
- 12346 Orizaba Ave
- 12349 Gneiss Ave
- 12350 Orizaba Ave
- 12343 Gneiss Ave
- 12306 Orizaba Ave
- 12367 Gneiss Ave
- 12319 Orizaba Ave
- 12337 Orizaba Ave
- 12333 Orizaba Ave
- 12327 Orizaba Ave
- 12315 Orizaba Ave
- 12337 Gneiss Ave
Your Personal Tour Guide
Ask me questions while you tour the home.