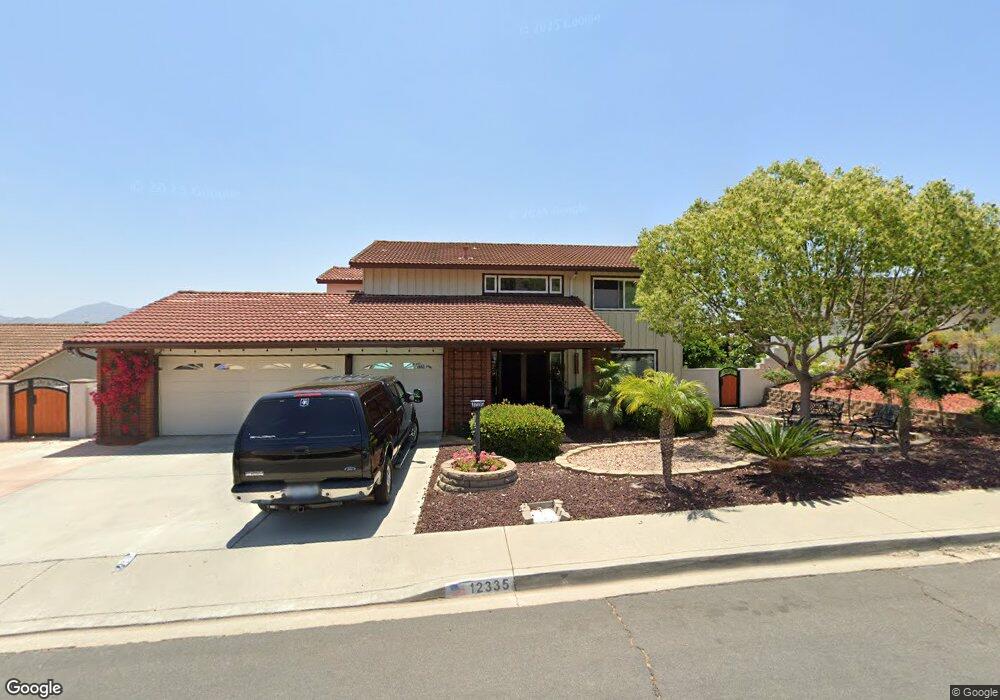
12335 Fernando Dr San Diego, CA 92128
Rancho Bernardo NeighborhoodEstimated Value: $1,464,000 - $1,598,000
4
Beds
3
Baths
2,646
Sq Ft
$577/Sq Ft
Est. Value
About This Home
This home is located at 12335 Fernando Dr, San Diego, CA 92128 and is currently estimated at $1,527,540, approximately $577 per square foot. 12335 Fernando Dr is a home located in San Diego County with nearby schools including Chaparral Elementary, Bernardo Heights Middle, and Rancho Bernardo High.
Ownership History
Date
Name
Owned For
Owner Type
Purchase Details
Closed on
Jun 23, 2021
Sold by
Hartley Rosanne I and Hartley Derek R
Bought by
Hartley Derek R and Hartley Rosanne I
Current Estimated Value
Home Financials for this Owner
Home Financials are based on the most recent Mortgage that was taken out on this home.
Original Mortgage
$741,600
Outstanding Balance
$671,426
Interest Rate
2.9%
Mortgage Type
VA
Estimated Equity
$856,114
Purchase Details
Closed on
Mar 29, 2021
Sold by
Hartley Rosanne I and Hartley Derek R
Bought by
Hartley Derek R and Hartley Rosanne I
Purchase Details
Closed on
Oct 28, 2011
Sold by
Schiele Jane O
Bought by
Hartley Rosanne I and Hartley Derek R
Home Financials for this Owner
Home Financials are based on the most recent Mortgage that was taken out on this home.
Original Mortgage
$559,963
Interest Rate
4.06%
Mortgage Type
VA
Create a Home Valuation Report for This Property
The Home Valuation Report is an in-depth analysis detailing your home's value as well as a comparison with similar homes in the area
Home Values in the Area
Average Home Value in this Area
Purchase History
| Date | Buyer | Sale Price | Title Company |
|---|---|---|---|
| Hartley Derek R | -- | Western Resources Inc | |
| Hartley Rosanne I | -- | Western Resources Title | |
| Hartley Derek R | -- | None Available | |
| Hartley Rosanne I | $555,000 | Fidelity National Title |
Source: Public Records
Mortgage History
| Date | Status | Borrower | Loan Amount |
|---|---|---|---|
| Open | Hartley Rosanne I | $741,600 | |
| Closed | Hartley Rosanne I | $559,963 |
Source: Public Records
Tax History Compared to Growth
Tax History
| Year | Tax Paid | Tax Assessment Tax Assessment Total Assessment is a certain percentage of the fair market value that is determined by local assessors to be the total taxable value of land and additions on the property. | Land | Improvement |
|---|---|---|---|---|
| 2025 | $5,838 | $697,096 | $270,489 | $426,607 |
| 2024 | $5,838 | $683,429 | $265,186 | $418,243 |
| 2023 | $7,585 | $670,030 | $259,987 | $410,043 |
| 2022 | $7,459 | $656,893 | $254,890 | $402,003 |
| 2021 | $7,362 | $644,014 | $249,893 | $394,121 |
| 2020 | $7,263 | $637,411 | $247,331 | $390,080 |
| 2019 | $7,075 | $624,914 | $242,482 | $382,432 |
| 2018 | $6,876 | $612,662 | $237,728 | $374,934 |
| 2017 | $6,693 | $600,650 | $233,067 | $367,583 |
| 2016 | $6,556 | $588,874 | $228,498 | $360,376 |
| 2015 | $6,459 | $580,029 | $225,066 | $354,963 |
| 2014 | $6,307 | $568,668 | $220,658 | $348,010 |
Source: Public Records
Map
Nearby Homes
- 18304 Vezelay Ln
- 18358 Locksley St
- 18614 Caminito Cantilena Unit 324
- 12434 Cloudesly Dr
- 18557 Caminito Pasadero Unit 389
- 18577 Caminito Pasadero Unit 408
- 12564 Chetenham Ln
- 12512 Cloudesly Dr
- 18650 Caminito Cantilena Unit 283
- 18650 Cantilena Unit 291
- 18638 Caminito Pasadero
- 18600 Caminito Pasadero
- 18680 Caminito Cantilena Unit 234
- 18761 Caminito Pasadero Unit 102
- 18640 Caminito Pasadero
- 18771 Caminito Pasadero Unit 66
- 18682 Lancashire Way
- 18752 Caminito Cantilena Unit 170
- 18752 Caminito Cantilena Unit 176
- 18197 Valladares Dr
- 12345 Fernando Dr
- 12325 Fernando Dr
- 12328 Escala Dr
- 12336 Escala Dr
- 12320 Escala Dr
- 12344 Escala Dr
- 12355 Fernando Dr
- 12315 Fernando Dr
- 12336 Fernando Dr
- 12326 Fernando Dr
- 12346 Fernando Dr
- 12312 Escala Dr
- 12352 Escala Dr
- 12316 Fernando Dr
- 12365 Fernando Dr
- 12305 Fernando Dr
- 12356 Fernando Dr
- 12304 Escala Dr
- 12306 Fernando Dr
- 12335 Escala Dr