12335 Rio Oso Rd Auburn, CA 95602
Estimated Value: $341,000 - $579,000
3
Beds
2
Baths
1,056
Sq Ft
$435/Sq Ft
Est. Value
About This Home
This home is located at 12335 Rio Oso Rd, Auburn, CA 95602 and is currently estimated at $459,278, approximately $434 per square foot. 12335 Rio Oso Rd is a home located in Placer County with nearby schools including Placer High School, Cornerstone Christian Schools, and Taylor Academy.
Ownership History
Date
Name
Owned For
Owner Type
Purchase Details
Closed on
Mar 27, 2014
Sold by
Deortega Marcelina Murguia
Bought by
Suarez Alberto O
Current Estimated Value
Home Financials for this Owner
Home Financials are based on the most recent Mortgage that was taken out on this home.
Original Mortgage
$131,000
Interest Rate
4.32%
Mortgage Type
New Conventional
Purchase Details
Closed on
May 25, 2004
Sold by
Ortega Marcelina
Bought by
Suarez Alberto O
Home Financials for this Owner
Home Financials are based on the most recent Mortgage that was taken out on this home.
Original Mortgage
$264,400
Outstanding Balance
$127,617
Interest Rate
5.92%
Mortgage Type
Purchase Money Mortgage
Estimated Equity
$331,661
Purchase Details
Closed on
Mar 31, 1995
Sold by
Mccaffrey John and Mccaffrey Virginia
Bought by
Mccaffrey John J and Mccaffrey Virginia S
Create a Home Valuation Report for This Property
The Home Valuation Report is an in-depth analysis detailing your home's value as well as a comparison with similar homes in the area
Home Values in the Area
Average Home Value in this Area
Purchase History
| Date | Buyer | Sale Price | Title Company |
|---|---|---|---|
| Suarez Alberto O | -- | Placer Title Company | |
| Suarez Alberto O | -- | Chicago Title | |
| Suarez Alberto O | $339,000 | Chicago Title | |
| Mccaffrey John J | -- | -- | |
| Mccaffrey John J | -- | -- |
Source: Public Records
Mortgage History
| Date | Status | Borrower | Loan Amount |
|---|---|---|---|
| Closed | Suarez Alberto O | $131,000 | |
| Open | Suarez Alberto O | $264,400 |
Source: Public Records
Tax History Compared to Growth
Tax History
| Year | Tax Paid | Tax Assessment Tax Assessment Total Assessment is a certain percentage of the fair market value that is determined by local assessors to be the total taxable value of land and additions on the property. | Land | Improvement |
|---|---|---|---|---|
| 2025 | $3,574 | $339,789 | $156,388 | $183,401 |
| 2023 | $3,574 | $326,596 | $150,316 | $176,280 |
| 2022 | $3,520 | $320,193 | $147,369 | $172,824 |
| 2021 | $3,395 | $313,916 | $144,480 | $169,436 |
| 2020 | $3,205 | $295,000 | $135,800 | $159,200 |
| 2019 | $3,213 | $295,469 | $136,000 | $159,469 |
| 2018 | $2,953 | $281,000 | $129,300 | $151,700 |
| 2017 | $2,835 | $269,000 | $123,800 | $145,200 |
| 2016 | $2,574 | $244,000 | $112,300 | $131,700 |
| 2015 | $2,459 | $235,000 | $108,200 | $126,800 |
| 2014 | $2,337 | $222,000 | $102,200 | $119,800 |
Source: Public Records
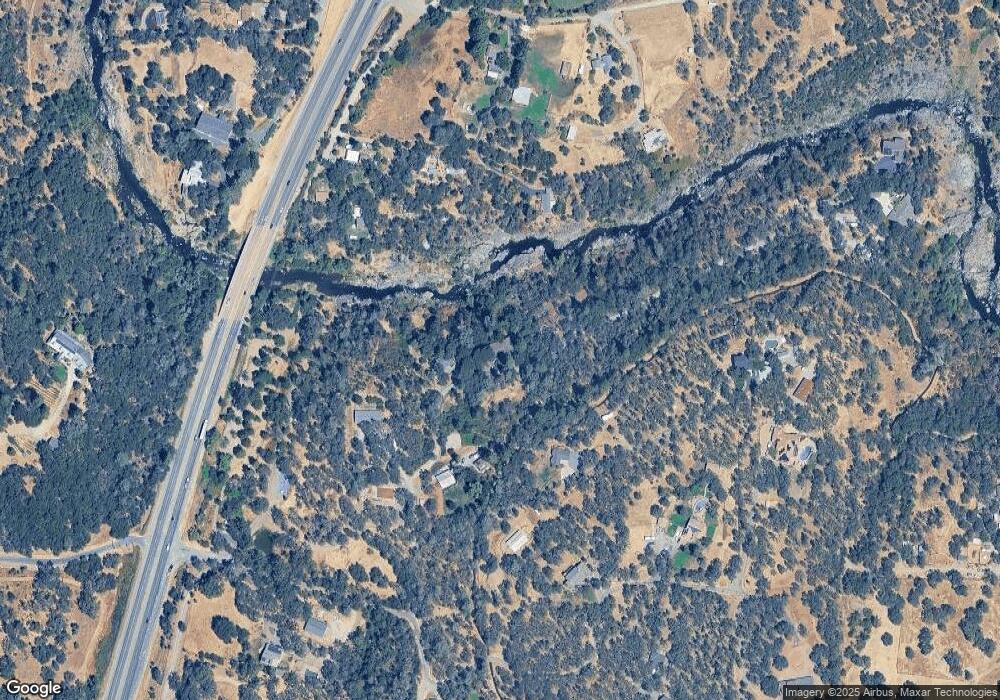
Map
Nearby Homes
- 6715 Grass Valley Hwy
- 13399 Bell Brook Dr
- 22495 Hidden Ranch Rd
- 14580 Mcelroy Rd
- 6890 Country Side Ln
- 0 Mcelroy Rd Unit 225065625
- 4 La Dolce Vita
- 24316 Timber Ridge Dr
- 23427 Macy Place
- 24640 Scooter Bug Ln
- 0 Fawnridge Rd
- 4765 Garden Ct
- 3375 Sugar View Rd
- 25407 Table Meadow Rd
- 24550 Rodeo Flat Rd
- 9825 Spyglass Cir
- 0 Unit 225070524
- 1 Joeger Rd
- 6200 Viewridge Dr
- 6262 View Ridge Dr
- 12315 Rio Oso Rd
- 25081 State Highway 49
- 12250 Rio Oso Rd
- 12285 Rio Oso Rd
- 12270 Rio Oso Rd
- 25093 California 49
- 25087 State Highway 49
- 25069 State Highway 49
- 25099 State Highway 49
- 6850 Grass Valley Hwy
- 25039 State Highway 49
- 12240 Rio Oso Rd
- 12555 Big Sky Place
- 12777 Big Sky Place
- 10069 Linnet Ln
- 10075 Linnet Ln
- 10077 Linnet Ln
- 12999 Big Sky Place
- 0 Big Sky Place
- 25090 California 49