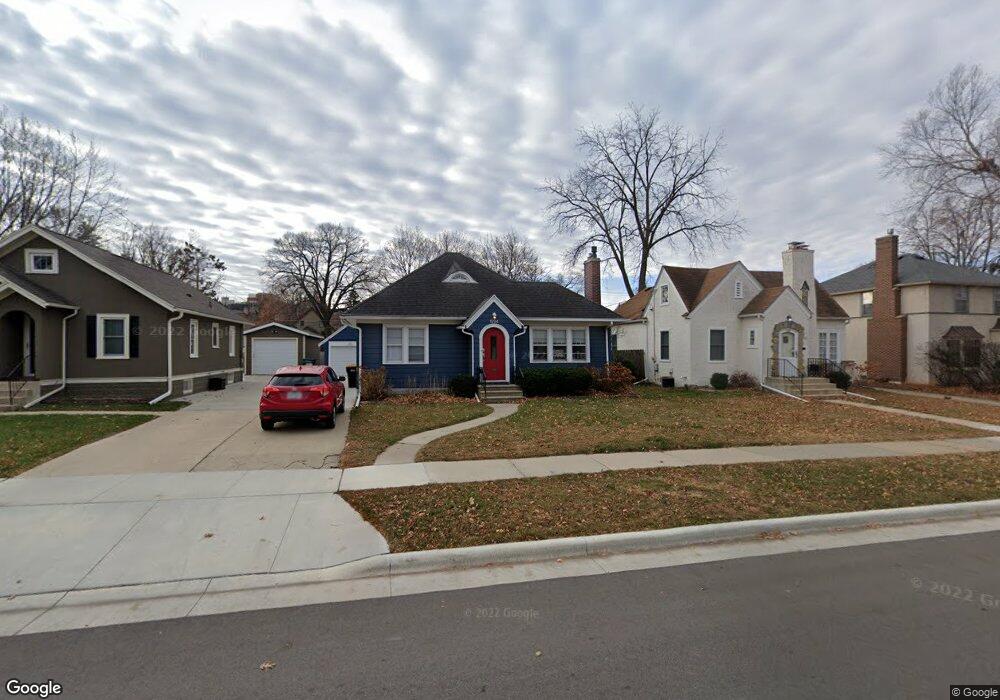
1234 2nd St NW Rochester, MN 55901
Kutzky Park NeighborhoodEstimated Value: $344,000 - $372,000
3
Beds
2
Baths
1,966
Sq Ft
$182/Sq Ft
Est. Value
About This Home
This home is located at 1234 2nd St NW, Rochester, MN 55901 and is currently estimated at $357,518, approximately $181 per square foot. 1234 2nd St NW is a home located in Olmsted County with nearby schools including John Adams Middle School, John Marshall Senior High School, and St. Pius X School.
Ownership History
Date
Name
Owned For
Owner Type
Purchase Details
Closed on
Nov 28, 2023
Sold by
Garcia Ali Austreberto Duarte and De La Garza
Bought by
Garcia Ali Austreberto and De La Garza
Current Estimated Value
Purchase Details
Closed on
Sep 14, 2016
Sold by
Gustafson Erin A
Bought by
Duarte Garcia Ali Austreberto and Delagarza Maria Mendoza
Home Financials for this Owner
Home Financials are based on the most recent Mortgage that was taken out on this home.
Original Mortgage
$172,000
Interest Rate
3.43%
Mortgage Type
New Conventional
Purchase Details
Closed on
Apr 30, 2012
Sold by
Kostick Andrea J
Bought by
Gustafson Erin A
Home Financials for this Owner
Home Financials are based on the most recent Mortgage that was taken out on this home.
Original Mortgage
$148,975
Interest Rate
3.75%
Mortgage Type
FHA
Create a Home Valuation Report for This Property
The Home Valuation Report is an in-depth analysis detailing your home's value as well as a comparison with similar homes in the area
Home Values in the Area
Average Home Value in this Area
Purchase History
| Date | Buyer | Sale Price | Title Company |
|---|---|---|---|
| Garcia Ali Austreberto | -- | None Listed On Document | |
| Garcia Ali Austreberto | $500 | None Listed On Document | |
| Garcia Ali Austreberto | $500 | None Listed On Document | |
| Duarte Garcia Ali Austreberto | $215,000 | Rochester Title & Escrow Co | |
| Gustafson Erin A | $157,500 | Rochester Title & Escrow Co |
Source: Public Records
Mortgage History
| Date | Status | Borrower | Loan Amount |
|---|---|---|---|
| Previous Owner | Duarte Garcia Ali Austreberto | $172,000 | |
| Previous Owner | Gustafson Erin A | $148,975 |
Source: Public Records
Tax History Compared to Growth
Tax History
| Year | Tax Paid | Tax Assessment Tax Assessment Total Assessment is a certain percentage of the fair market value that is determined by local assessors to be the total taxable value of land and additions on the property. | Land | Improvement |
|---|---|---|---|---|
| 2024 | $3,738 | $267,300 | $50,000 | $217,300 |
| 2023 | $3,526 | $280,000 | $50,000 | $230,000 |
| 2022 | $3,002 | $251,000 | $50,000 | $201,000 |
| 2021 | $2,994 | $218,200 | $50,000 | $168,200 |
| 2020 | $2,668 | $217,400 | $50,000 | $167,400 |
| 2019 | $2,446 | $202,100 | $50,000 | $152,100 |
| 2018 | $1,902 | $188,400 | $50,000 | $138,400 |
| 2017 | $1,638 | $169,200 | $40,000 | $129,200 |
| 2016 | $1,544 | $108,200 | $24,300 | $83,900 |
| 2015 | $1,450 | $99,800 | $15,900 | $83,900 |
| 2014 | $1,410 | $100,700 | $15,900 | $84,800 |
| 2012 | -- | $100,500 | $15,902 | $84,598 |
Source: Public Records
Map
Nearby Homes
- 1142 2nd St NW
- 327 11th Ave NW
- 926 2nd St NW
- 919 1st St NW
- 117 9th Ave NW
- 1729 W Center St
- 842 2nd St NW
- 121 18th Ave NW
- 430 15th Ave SW
- 1/2 2nd St SW
- 1516 5th St SW
- 913 7th St NW
- 909 7th St NW
- 724 4th St SW
- 925 6th St SW
- 812 9th Ave NW
- 1912 3rd St SW
- 811 6th St SW
- 600 4th St SW Unit 405
- 600 4th St SW Unit 308
- 1230 2nd St NW
- 1230 1230 2nd St NW
- 1238 2nd St NW
- 118 13th Ave NW
- 1226 2nd St NW
- 1239 1239 2nd-Street-nw
- 1226 1226 2nd-Street-nw
- 1242 2nd St NW
- 1222 2nd St NW
- 1239 2nd St NW
- 1239 1st St NW
- 1229 2nd St NW
- 1225 1225 1st-Street-nw
- 1225 1225 1st St NW
- 1243 1st St NW
- 1243 1243 1st St NW
- 1216 2nd St NW
- 1225 2nd St NW
- 1216 1216 2nd-Street-nw
- 202 13th Ave NW