1234 Bay St Unit 1238 Fall River, MA 02724
Sandy Beach NeighborhoodEstimated Value: $545,087
6
Beds
2
Baths
3,136
Sq Ft
$174/Sq Ft
Est. Value
About This Home
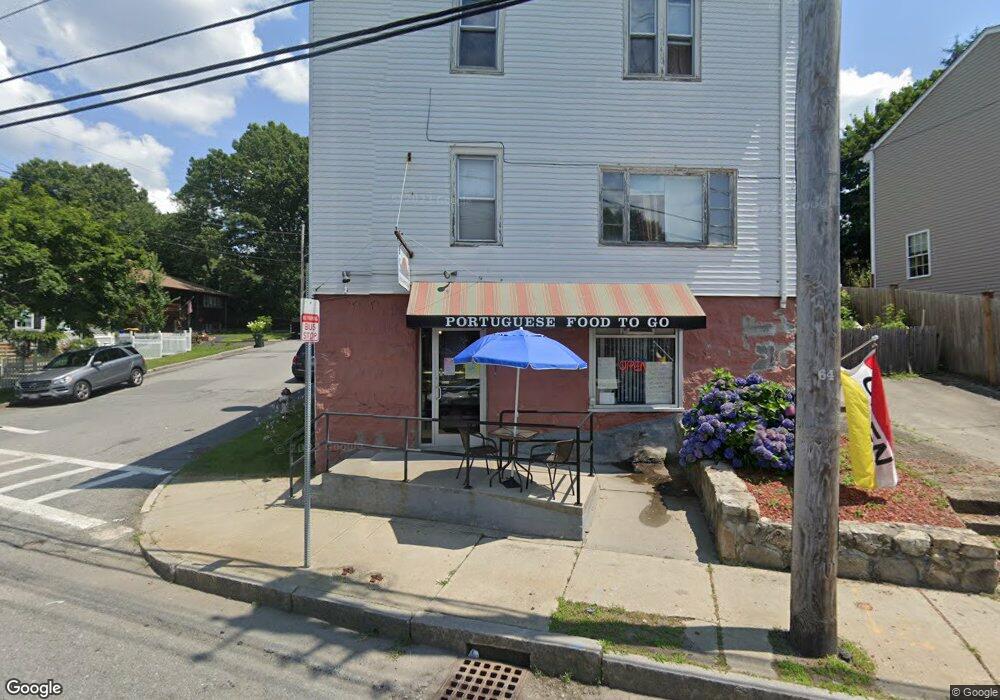
This home is located at 1234 Bay St Unit 1238, Fall River, MA 02724 and is currently estimated at $545,087, approximately $173 per square foot. 1234 Bay St Unit 1238 is a home located in Bristol County with nearby schools including Carlton M. Viveiros Elementary School, Matthew J. Kuss Middle School, and B M C Durfee High School.
Ownership History
Date
Name
Owned For
Owner Type
Purchase Details
Closed on
Nov 8, 2005
Sold by
J Azevedo Constr Llc
Bought by
Souza Fabricio
Current Estimated Value
Home Financials for this Owner
Home Financials are based on the most recent Mortgage that was taken out on this home.
Original Mortgage
$240,800
Outstanding Balance
$128,829
Interest Rate
5.85%
Mortgage Type
Commercial
Estimated Equity
$416,258
Purchase Details
Closed on
Apr 20, 2004
Sold by
Berkmont Rt and Leduc Leo H
Bought by
Azevedo Joseph A
Purchase Details
Closed on
Feb 26, 2003
Sold by
Gromada Alice A and Gromada Edward M
Bought by
Azevedo Joseph A
Create a Home Valuation Report for This Property
The Home Valuation Report is an in-depth analysis detailing your home's value as well as a comparison with similar homes in the area
Home Values in the Area
Average Home Value in this Area
Purchase History
| Date | Buyer | Sale Price | Title Company |
|---|---|---|---|
| Souza Fabricio | $301,000 | -- | |
| Souza Fabricio | $301,000 | -- | |
| Azevedo Joseph A | $69,000 | -- | |
| Azevedo Joseph A | $69,000 | -- | |
| Azevedo Joseph A | $59,000 | -- |
Source: Public Records
Mortgage History
| Date | Status | Borrower | Loan Amount |
|---|---|---|---|
| Open | Souza Fabricio | $240,800 | |
| Closed | Azevedo Joseph A | $240,800 |
Source: Public Records
Tax History Compared to Growth
Tax History
| Year | Tax Paid | Tax Assessment Tax Assessment Total Assessment is a certain percentage of the fair market value that is determined by local assessors to be the total taxable value of land and additions on the property. | Land | Improvement |
|---|---|---|---|---|
| 2025 | $3,131 | $282,300 | $124,400 | $157,900 |
| 2024 | $3,131 | $272,500 | $119,700 | $152,800 |
| 2023 | $0 | $204,400 | $102,600 | $101,800 |
| 2022 | $0 | $195,100 | $93,300 | $101,800 |
| 2021 | $0 | $189,600 | $86,300 | $103,300 |
| 2020 | $4,348 | $202,000 | $82,600 | $119,400 |
| 2019 | $4,088 | $212,700 | $78,700 | $134,000 |
| 2018 | $0 | $202,800 | $77,200 | $125,600 |
| 2017 | -- | $197,100 | $78,800 | $118,300 |
| 2016 | -- | $197,100 | $82,000 | $115,100 |
| 2015 | -- | $197,000 | $79,000 | $118,000 |
| 2014 | $2,229 | $177,200 | $83,200 | $94,000 |
Source: Public Records
Map
Nearby Homes
- 289 King Philip St
- 160 Foote St
- 321 King St
- 25 Winward St
- 644-648 King Philip St
- 27 Vista Way
- 636-644 Dwelly St
- 24 Hall St
- 616 Woodman St
- 123 Hall St
- 15 Higgins St
- 66 Bailey St
- 20 Wilcox St
- 126 Wheeler St
- 584-586 Mount Hope Ave
- 31 Barker St
- 59 Mount Hope Ave
- 909 Dwelly St
- 1313 So Main St Unit 2
- 1334 S Main St