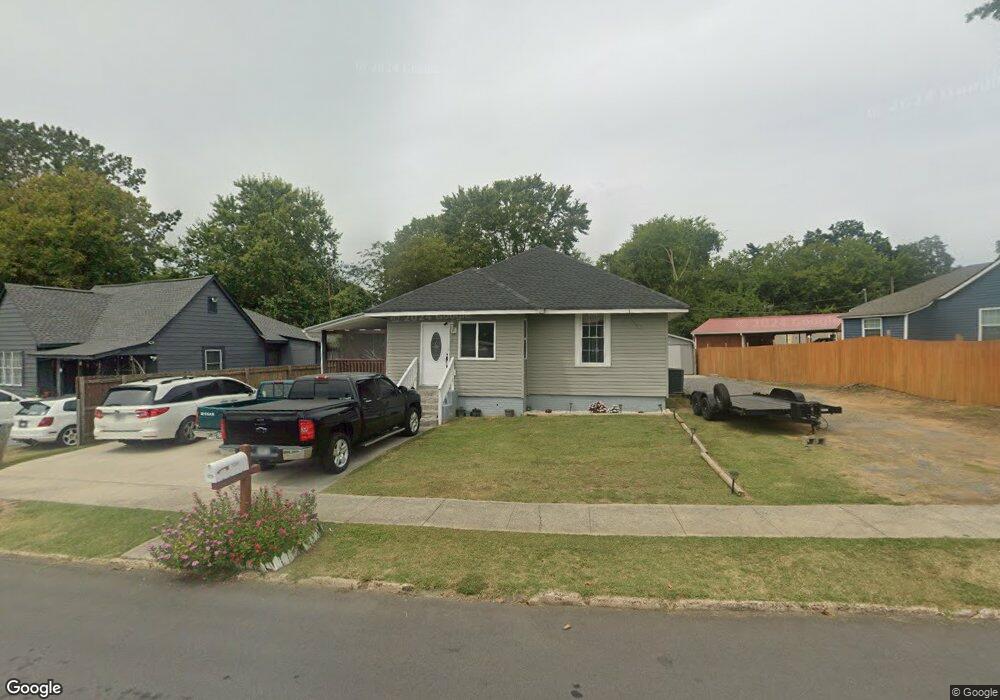
1234 Crescent St Dalton, GA 30720
Estimated Value: $116,000 - $191,000
--
Bed
1
Bath
739
Sq Ft
$213/Sq Ft
Est. Value
About This Home
This home is located at 1234 Crescent St, Dalton, GA 30720 and is currently estimated at $157,243, approximately $212 per square foot. 1234 Crescent St is a home located in Whitfield County with nearby schools including Brookwood Elementary School, Dalton Middle School, and Dalton High School.
Ownership History
Date
Name
Owned For
Owner Type
Purchase Details
Closed on
Jul 12, 2018
Sold by
Silva Marcelino F
Bought by
Valdivias Estela V
Current Estimated Value
Purchase Details
Closed on
Nov 1, 2012
Sold by
Robbins Dorothy G
Bought by
Silva Marcelino Fernandez
Home Financials for this Owner
Home Financials are based on the most recent Mortgage that was taken out on this home.
Original Mortgage
$6,000
Interest Rate
3.4%
Mortgage Type
New Conventional
Purchase Details
Closed on
Mar 1, 1991
Bought by
Robbins Dorothy G
Create a Home Valuation Report for This Property
The Home Valuation Report is an in-depth analysis detailing your home's value as well as a comparison with similar homes in the area
Home Values in the Area
Average Home Value in this Area
Purchase History
| Date | Buyer | Sale Price | Title Company |
|---|---|---|---|
| Valdivias Estela V | -- | -- | |
| Silva Marcelino Fernandez | $26,000 | -- | |
| Robbins Dorothy G | $28,400 | -- |
Source: Public Records
Mortgage History
| Date | Status | Borrower | Loan Amount |
|---|---|---|---|
| Previous Owner | Silva Marcelino Fernandez | $6,000 |
Source: Public Records
Tax History Compared to Growth
Tax History
| Year | Tax Paid | Tax Assessment Tax Assessment Total Assessment is a certain percentage of the fair market value that is determined by local assessors to be the total taxable value of land and additions on the property. | Land | Improvement |
|---|---|---|---|---|
| 2024 | $969 | $46,646 | $7,600 | $39,046 |
| 2023 | $969 | $30,452 | $7,200 | $23,252 |
| 2022 | $954 | $27,700 | $8,400 | $19,300 |
| 2021 | $956 | $27,700 | $8,400 | $19,300 |
| 2020 | $992 | $27,700 | $8,400 | $19,300 |
| 2019 | $803 | $21,726 | $8,400 | $13,326 |
| 2018 | $671 | $17,894 | $8,400 | $9,494 |
| 2017 | $646 | $17,894 | $8,400 | $9,494 |
| 2016 | $422 | $11,626 | $2,940 | $8,686 |
| 2014 | $499 | $15,110 | $2,940 | $12,170 |
| 2013 | -- | $15,110 | $2,940 | $12,170 |
Source: Public Records
Map
Nearby Homes