Estimated Value: $774,478 - $804,000
4
Beds
2
Baths
1,793
Sq Ft
$440/Sq Ft
Est. Value
About This Home
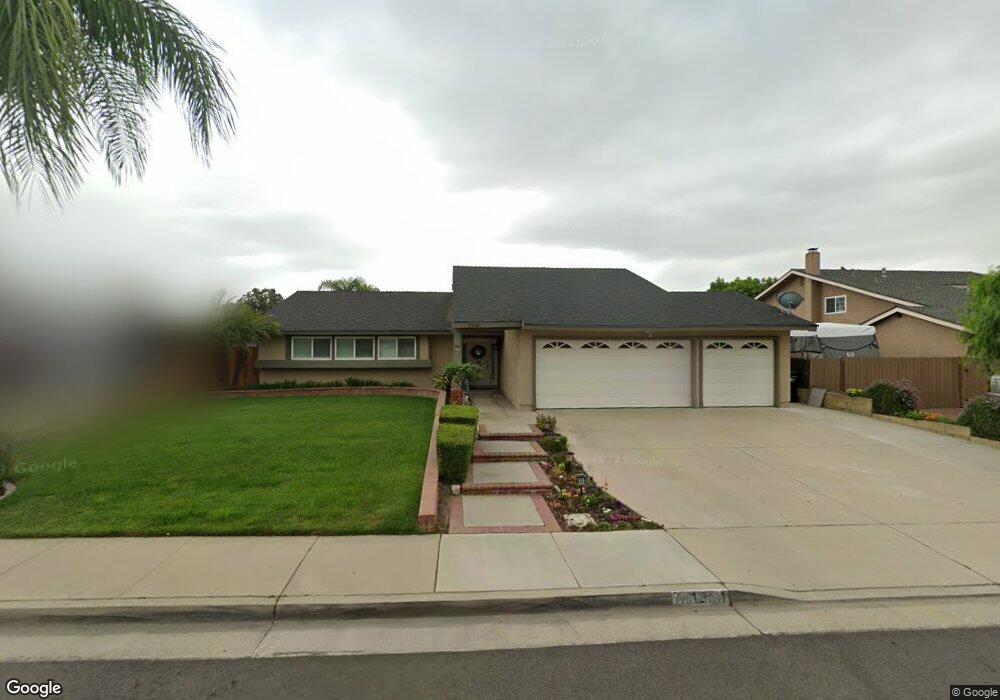
This home is located at 12341 Apple Dr, Chino, CA 91710 and is currently estimated at $788,620, approximately $439 per square foot. 12341 Apple Dr is a home located in San Bernardino County with nearby schools including Alicia Cortez Elementary, Magnolia Junior High, and Chino High School.
Ownership History
Date
Name
Owned For
Owner Type
Purchase Details
Closed on
Mar 15, 2021
Sold by
Betancourt Norma
Bought by
Betancourt Norma
Current Estimated Value
Home Financials for this Owner
Home Financials are based on the most recent Mortgage that was taken out on this home.
Original Mortgage
$310,000
Outstanding Balance
$277,893
Interest Rate
2.7%
Mortgage Type
New Conventional
Estimated Equity
$510,727
Purchase Details
Closed on
Nov 9, 2017
Sold by
Betancourt Danny J and Betancourt Norma
Bought by
Betancourt Norma
Purchase Details
Closed on
May 14, 1999
Sold by
Abdallah Yaser M
Bought by
Betancourt Danny J and Betancourt Norma
Home Financials for this Owner
Home Financials are based on the most recent Mortgage that was taken out on this home.
Original Mortgage
$163,651
Interest Rate
6.84%
Mortgage Type
FHA
Create a Home Valuation Report for This Property
The Home Valuation Report is an in-depth analysis detailing your home's value as well as a comparison with similar homes in the area
Home Values in the Area
Average Home Value in this Area
Purchase History
| Date | Buyer | Sale Price | Title Company |
|---|---|---|---|
| Betancourt Norma | -- | Usa National Title Company | |
| Betancourt Norma | -- | None Available | |
| Betancourt Danny J | $165,000 | -- |
Source: Public Records
Mortgage History
| Date | Status | Borrower | Loan Amount |
|---|---|---|---|
| Open | Betancourt Norma | $310,000 | |
| Closed | Betancourt Danny J | $163,651 |
Source: Public Records
Tax History Compared to Growth
Tax History
| Year | Tax Paid | Tax Assessment Tax Assessment Total Assessment is a certain percentage of the fair market value that is determined by local assessors to be the total taxable value of land and additions on the property. | Land | Improvement |
|---|---|---|---|---|
| 2025 | $2,745 | $258,677 | $90,538 | $168,139 |
| 2024 | $2,745 | $253,605 | $88,763 | $164,842 |
| 2023 | $2,668 | $248,633 | $87,023 | $161,610 |
| 2022 | $2,651 | $243,758 | $85,317 | $158,441 |
| 2021 | $2,598 | $238,978 | $83,644 | $155,334 |
| 2020 | $2,564 | $236,527 | $82,786 | $153,741 |
| 2019 | $2,518 | $231,889 | $81,163 | $150,726 |
| 2018 | $2,461 | $227,343 | $79,572 | $147,771 |
| 2017 | $2,416 | $222,886 | $78,012 | $144,874 |
| 2016 | $2,257 | $218,515 | $76,482 | $142,033 |
| 2015 | $2,284 | $215,233 | $75,333 | $139,900 |
| 2014 | $2,239 | $211,017 | $73,857 | $137,160 |
Source: Public Records
Map
Nearby Homes
- 12321 Gardenia Place
- 2321 S Magnolia Ave Unit 6E
- 12524 Ross Ave
- 926 W Philadelphia St Unit 49
- 926 W Philadelphia St Unit R99
- 926 W Philadelphia St Unit 10
- 12638 Verdugo Ave
- 12351 Twin Gables Dr
- 12689 Cypress Ave
- 5610 Guardian Way
- 6542 Hamilton St
- 12811 Oaks Ave
- 12796 17th St
- 6703 Poinsettia Ct
- 12936 Cambridge Ct
- 6736 Aster Ct
- 558 W Philadelphia St
- 5925 Riverside Dr Unit 12
- 6763 Poinsettia Ct
- 12951 Red Cedar Way
- 12331 Apple Dr
- 12351 Apple Dr
- 12344 Aralia Dr
- 12334 Aralia Dr
- 12354 Aralia Dr
- 12361 Apple Dr
- 12338 Apple Dr
- 12348 Apple Dr
- 12364 Aralia Dr
- 12328 Apple Dr
- 12358 Apple Dr
- 12371 Apple Dr
- 12374 Aralia Dr
- 12368 Apple Dr
- 12333 Magnolia Ave
- 12343 Magnolia Ave
- 12337 Aralia Dr
- 12347 Aralia Dr
- 12381 Apple Dr
- 12323 Magnolia Ave