Estimated Value: $729,000 - $769,000
4
Beds
2
Baths
1,430
Sq Ft
$522/Sq Ft
Est. Value
About This Home
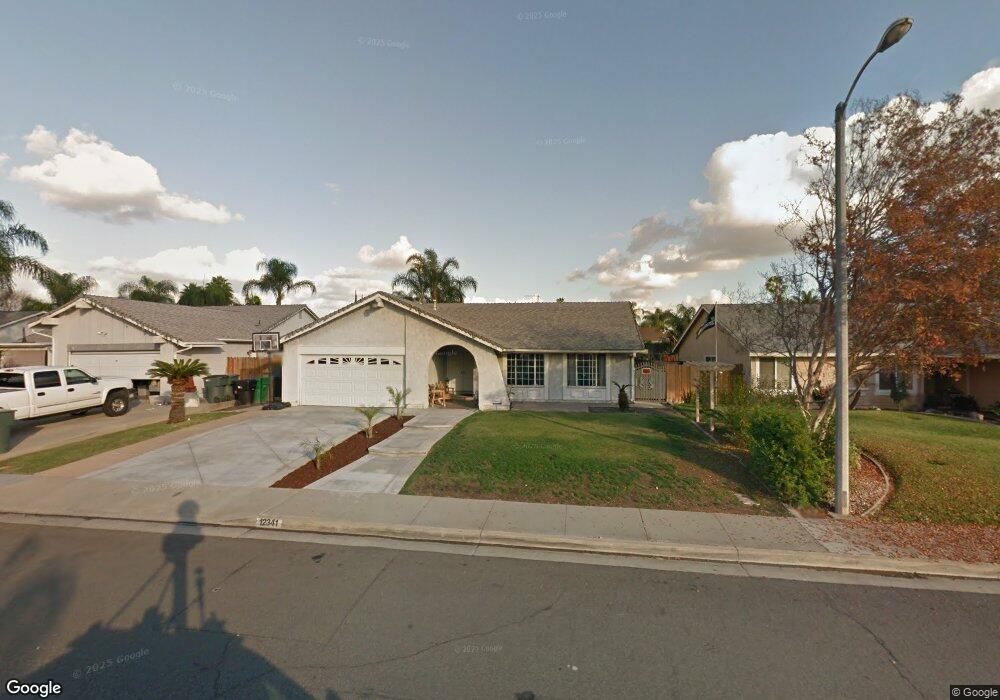
This home is located at 12341 Sonoma Ct, Chino, CA 91710 and is currently estimated at $746,972, approximately $522 per square foot. 12341 Sonoma Ct is a home located in San Bernardino County with nearby schools including Newman Elementary, Ramona Junior High School, and Don Antonio Lugo High School.
Ownership History
Date
Name
Owned For
Owner Type
Purchase Details
Closed on
Jun 3, 2011
Sold by
Lenders Group
Bought by
Caldera Lisa Marie and Caldera Darlene
Current Estimated Value
Home Financials for this Owner
Home Financials are based on the most recent Mortgage that was taken out on this home.
Original Mortgage
$274,851
Outstanding Balance
$190,187
Interest Rate
4.71%
Mortgage Type
FHA
Estimated Equity
$556,785
Purchase Details
Closed on
Jan 27, 2011
Sold by
Diaz Dan
Bought by
Lenders Group
Home Financials for this Owner
Home Financials are based on the most recent Mortgage that was taken out on this home.
Original Mortgage
$237,604
Interest Rate
4.84%
Mortgage Type
Purchase Money Mortgage
Purchase Details
Closed on
Jan 24, 2011
Sold by
Maldonado Antonio
Bought by
Diaz Dan
Home Financials for this Owner
Home Financials are based on the most recent Mortgage that was taken out on this home.
Original Mortgage
$237,604
Interest Rate
4.84%
Mortgage Type
Purchase Money Mortgage
Create a Home Valuation Report for This Property
The Home Valuation Report is an in-depth analysis detailing your home's value as well as a comparison with similar homes in the area
Home Values in the Area
Average Home Value in this Area
Purchase History
| Date | Buyer | Sale Price | Title Company |
|---|---|---|---|
| Caldera Lisa Marie | $282,000 | Ticor Title | |
| Lenders Group | -- | Ticor Title Company | |
| Diaz Dan | -- | Ticor Title Company |
Source: Public Records
Mortgage History
| Date | Status | Borrower | Loan Amount |
|---|---|---|---|
| Open | Caldera Lisa Marie | $274,851 | |
| Previous Owner | Diaz Dan | $237,604 |
Source: Public Records
Tax History Compared to Growth
Tax History
| Year | Tax Paid | Tax Assessment Tax Assessment Total Assessment is a certain percentage of the fair market value that is determined by local assessors to be the total taxable value of land and additions on the property. | Land | Improvement |
|---|---|---|---|---|
| 2025 | $3,853 | $361,292 | $126,837 | $234,455 |
| 2024 | $3,853 | $354,208 | $124,350 | $229,858 |
| 2023 | $3,745 | $347,263 | $121,912 | $225,351 |
| 2022 | $3,722 | $340,454 | $119,522 | $220,932 |
| 2021 | $3,648 | $333,778 | $117,178 | $216,600 |
| 2020 | $3,600 | $330,355 | $115,976 | $214,379 |
| 2019 | $3,536 | $323,877 | $113,702 | $210,175 |
| 2018 | $3,456 | $317,527 | $111,473 | $206,054 |
| 2017 | $3,393 | $311,301 | $109,287 | $202,014 |
| 2016 | $3,170 | $305,197 | $107,144 | $198,053 |
| 2015 | $3,105 | $300,613 | $105,535 | $195,078 |
| 2014 | $3,043 | $294,725 | $103,468 | $191,257 |
Source: Public Records
Map
Nearby Homes
- 3709 Kern Rd
- 12232 Roswell Ave
- 3954 Wakefield Ave
- 4025 Olive St
- 3964 Philadelphia St
- 4099 Walnut Ave
- 3778 Pilgrims Way
- 0 Pilgrims Way
- 12150 Orgren Ave
- 2416 Stanford Ave
- 2236 Ann Arbor Ave
- 2309 Ann Arbor Ave
- 3921 Francis Ave
- 3557 Riverside Dr
- 4400 Philadelphia St Unit 209
- 4400 Philadelphia St Unit 193
- 4400 Philadelphia St Unit 197
- 12540 Ramona Ave
- 4426 Gettysburg St
- 1982 Titus Ave
- 12339 Sonoma Ct
- 1235 Sonoma Ct
- 12353 Sonoma Ct
- 12346 Maxon Ln
- 12336 Maxon Ln
- 12375 Sonoma Ct
- 12327 Sonoma Ct
- 12358 Maxon Ln
- 12324 Maxon Ln
- 12340 Sonoma Ct
- 12352 Sonoma Ct
- 12377 Sonoma Ct
- 12315 Sonoma Ct
- 12338 Sonoma Ct
- 12364 Sonoma Ct
- 12372 Maxon Ln
- 12318 Maxon Ln
- 12326 Sonoma Ct
- 12376 Sonoma Ct
- 12389 Sonoma Ct