12344 Harbor Garden Grove, CA 92840
Estimated payment $33,421/month
Highlights
- City Lights View
- 18,731 Acre Lot
- No HOA
- Crosby Elementary School Rated A-
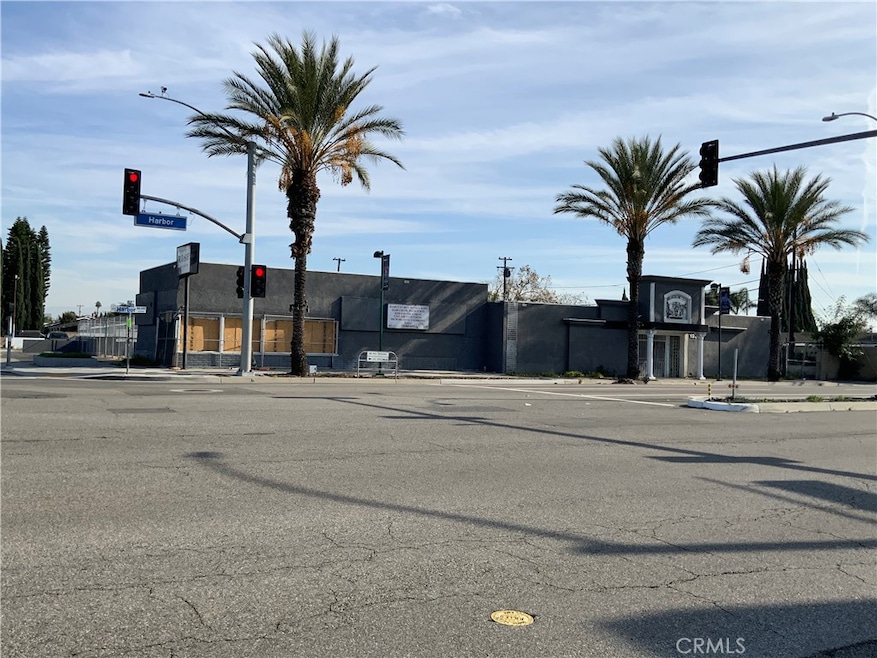
- Corner Lot
- Park
About This Lot
A wonderful opportunity to invest in the Disneyland Park area, 2 miles south on Harbor Blvd. There are currently multiple office buildings on the lot. It is a corner lot, Harbor Blvd & Twintree. Therefore, this is a great opportunity to be developed into a small boutique motel, mixed used property or restaurant and bar project.
Property Details
Property Type
- Land
Lot Details
- 18,731 Acre Lot
- Corner Lot
- Density is up to 1 Unit/Acre
- Property is zoned Commercial
Property Views
- City Lights
- Neighborhood
Utilities
- Phone Available
Listing and Financial Details
- Tax Lot 187
- Assessor Parcel Number 23152502
- $1,612 per year additional tax assessments
Community Details
Overview
- No Home Owners Association
Recreation
- Park
- Bike Trail
- Exterior Lighting
Map
Home Values in the Area
Average Home Value in this Area
Tax History
| Year | Tax Paid | Tax Assessment Tax Assessment Total Assessment is a certain percentage of the fair market value that is determined by local assessors to be the total taxable value of land and additions on the property. | Land | Improvement |
|---|---|---|---|---|
| 2025 | $25,479 | $2,040,000 | $1,754,400 | $285,600 |
| 2024 | $25,479 | $2,000,000 | $1,720,000 | $280,000 |
| 2023 | $15,341 | $1,183,606 | $828,527 | $355,079 |
| 2022 | $15,001 | $1,160,399 | $812,282 | $348,117 |
| 2021 | $15,179 | $1,137,647 | $796,355 | $341,292 |
| 2020 | $14,792 | $1,125,982 | $788,189 | $337,793 |
| 2019 | $14,421 | $1,103,904 | $772,734 | $331,170 |
| 2018 | $14,071 | $1,082,259 | $757,582 | $324,677 |
| 2017 | $13,927 | $1,061,039 | $742,728 | $318,311 |
| 2016 | $13,236 | $1,040,235 | $728,165 | $312,070 |
| 2015 | $13,065 | $1,024,610 | $717,227 | $307,383 |
| 2014 | $12,764 | $1,004,540 | $703,178 | $301,362 |
Property History
| Date | Event | Price | List to Sale | Price per Sq Ft |
|---|---|---|---|---|
| 12/12/2025 12/12/25 | For Sale | $5,950,000 | -- | -- |
Purchase History
| Date | Type | Sale Price | Title Company |
|---|---|---|---|
| Deed In Lieu Of Foreclosure | $847,024 | None Available | |
| Grant Deed | -- | None Available | |
| Grant Deed | -- | None Available | |
| Interfamily Deed Transfer | -- | None Available | |
| Interfamily Deed Transfer | -- | -- | |
| Interfamily Deed Transfer | -- | Investors Title Company | |
| Interfamily Deed Transfer | -- | -- | |
| Grant Deed | $330,000 | United Title Company |
Mortgage History
| Date | Status | Loan Amount | Loan Type |
|---|---|---|---|
| Previous Owner | $400,000 | Commercial | |
| Previous Owner | $238,000 | Commercial |
Source: California Regional Multiple Listing Service (CRMLS)
MLS Number: PW25275026
APN: 231-525-02
Disclaimer: Certain information contained herein is derived from information provided by parties other than Homes.com. All information provided is deemed reliable, but is not guaranteed to be accurate and should be independently verified.
![]() The multiple listing data appearing on this website, or contained in reports produced therefrom, is owned and copyrighted by California Regional Multiple Listing Service, Inc. ("CRMLS") and is protected by all applicable copyright laws. Information provided is for viewer's personal, non-commercial use and may not be used for any purpose other than to identify prospective properties the viewer may be interested in purchasing. All listing data, including but not limited to square footage and lot size is believed to be accurate, but the listing Agent, listing Broker and CRMLS and its affiliates do not warrant or guarantee such accuracy. The viewer should independently verify the listed data prior to making any decisions based on such information by personal inspection and/or contacting a real estate professional.
The multiple listing data appearing on this website, or contained in reports produced therefrom, is owned and copyrighted by California Regional Multiple Listing Service, Inc. ("CRMLS") and is protected by all applicable copyright laws. Information provided is for viewer's personal, non-commercial use and may not be used for any purpose other than to identify prospective properties the viewer may be interested in purchasing. All listing data, including but not limited to square footage and lot size is believed to be accurate, but the listing Agent, listing Broker and CRMLS and its affiliates do not warrant or guarantee such accuracy. The viewer should independently verify the listed data prior to making any decisions based on such information by personal inspection and/or contacting a real estate professional.
Based on information from California Regional Multiple Listing Service, Inc. and /or other sources. All data, including all measurements and calculations of area, is obtained from various sources and has not been, and will not be, verified by broker or MLS. All information should be independently reviewed and verified for accuracy. Properties may or may not be listed by the office/agent presenting the information
- 12246 Nadine Cir
- 11662 Pickett Ln
- 11531 Kathy Ln
- 12501 Dessa Dr
- 11402 Morgan Ln
- 12621 Kathy Ln
- 11341 Jacalene Ln
- 12662 Woodland Ln
- 11102 Avolencia Place
- 1664 W Ord Way
- 12677 8th St
- 12727 West St
- 12222 Emrys Ave
- 11081 Iris Dr
- 11741 Rose Dr
- Plan One at Rose Walk
- 12332 Euclid St
- 1907 S Gail Ln
- 12501 Willowood Ave
- 12861 West St Unit 157
- 11736 Rose Walk
- 11461 West St
- 19154 S Della Ln Unit Room 1
- 12131-12222 Tamerlane Dr
- 2175 S Mallul Dr
- 12673 9th St
- 11750 Euclid St
- 2064 S June Place
- 1658 W Cindy Ln Unit C
- 1683 W Cindy Ln Unit D
- 2170 S Harbor Blvd
- 11441 Acacia Pkwy
- 12668 W Chapman Ave
- 12668 Chapman Ave Unit 2415
- 2131 1/2 S Broden St
- 12042 Diane St
- 10902 Lampson Ave Unit 2
- 2121 S Camino St Unit D
- 401 W Orangewood Ave
- 13021 Sandra Studio Place Unit A
