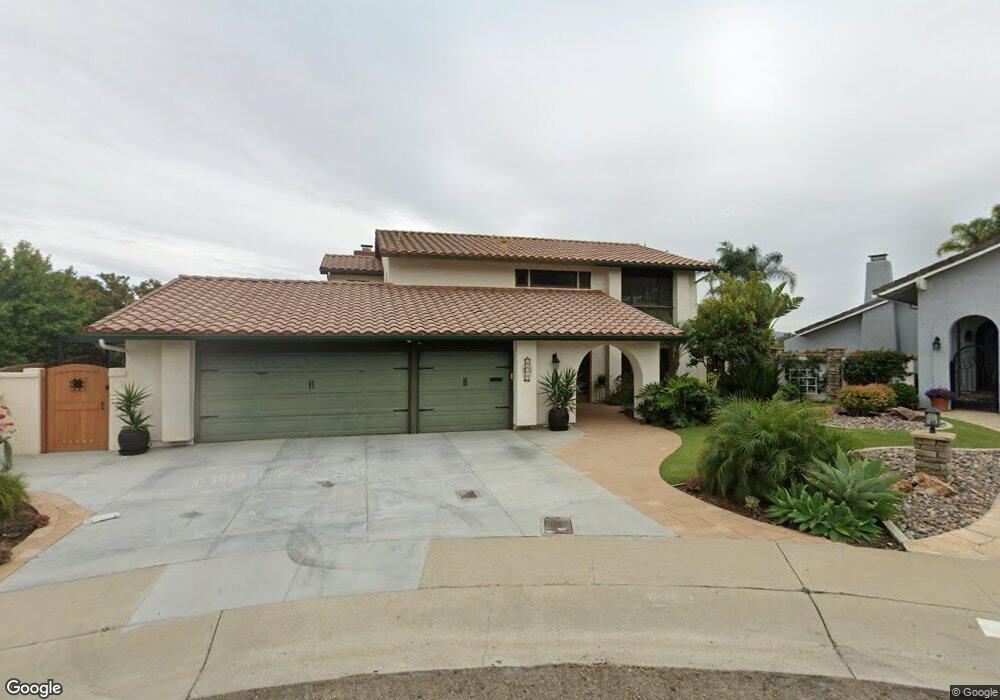
12347 Reata Ct San Diego, CA 92128
Rancho Bernardo NeighborhoodEstimated Value: $1,588,408 - $1,669,000
4
Beds
3
Baths
2,646
Sq Ft
$615/Sq Ft
Est. Value
About This Home
This home is located at 12347 Reata Ct, San Diego, CA 92128 and is currently estimated at $1,628,602, approximately $615 per square foot. 12347 Reata Ct is a home located in San Diego County with nearby schools including Chaparral Elementary, Bernardo Heights Middle, and Rancho Bernardo High.
Ownership History
Date
Name
Owned For
Owner Type
Purchase Details
Closed on
Oct 3, 2012
Sold by
Marsh Michael B and Marsh Barbara A
Bought by
Moroz Emil and Moroz Pauline
Current Estimated Value
Home Financials for this Owner
Home Financials are based on the most recent Mortgage that was taken out on this home.
Original Mortgage
$544,000
Outstanding Balance
$376,880
Interest Rate
3.52%
Mortgage Type
New Conventional
Estimated Equity
$1,251,722
Purchase Details
Closed on
Mar 30, 2007
Sold by
Marsh Michael Brian and Marsh Barbara Anita
Bought by
Marsh Michael B and Marsh Barbara A
Purchase Details
Closed on
Jan 14, 2001
Sold by
Boyle John G Trust 06-10-96 and John G
Bought by
Marsh Michael Brian and Marsh Barbara Anita
Home Financials for this Owner
Home Financials are based on the most recent Mortgage that was taken out on this home.
Original Mortgage
$328,000
Interest Rate
7%
Purchase Details
Closed on
May 15, 1997
Sold by
Boyle John G
Bought by
Boyle John G
Purchase Details
Closed on
Dec 9, 1994
Sold by
Boyle John G and June Boyle S
Bought by
Boyle John G
Create a Home Valuation Report for This Property
The Home Valuation Report is an in-depth analysis detailing your home's value as well as a comparison with similar homes in the area
Home Values in the Area
Average Home Value in this Area
Purchase History
| Date | Buyer | Sale Price | Title Company |
|---|---|---|---|
| Moroz Emil | $680,000 | Ticor Title San Diego Branch | |
| Marsh Michael B | -- | None Available | |
| Marsh Michael Brian | $410,000 | Chicago Title Co | |
| Boyle John G | -- | -- | |
| Boyle John G | -- | -- |
Source: Public Records
Mortgage History
| Date | Status | Borrower | Loan Amount |
|---|---|---|---|
| Open | Moroz Emil | $544,000 | |
| Previous Owner | Marsh Michael Brian | $328,000 |
Source: Public Records
Tax History Compared to Growth
Tax History
| Year | Tax Paid | Tax Assessment Tax Assessment Total Assessment is a certain percentage of the fair market value that is determined by local assessors to be the total taxable value of land and additions on the property. | Land | Improvement |
|---|---|---|---|---|
| 2025 | $9,218 | $837,356 | $469,738 | $367,618 |
| 2024 | $9,218 | $820,938 | $460,528 | $360,410 |
| 2023 | $9,021 | $804,843 | $451,499 | $353,344 |
| 2022 | $8,870 | $789,063 | $442,647 | $346,416 |
| 2021 | $8,753 | $773,592 | $433,968 | $339,624 |
| 2020 | $8,634 | $765,661 | $429,519 | $336,142 |
| 2019 | $8,408 | $750,649 | $421,098 | $329,551 |
| 2018 | $8,171 | $735,932 | $412,842 | $323,090 |
| 2017 | $7,951 | $721,503 | $404,748 | $316,755 |
| 2016 | $7,787 | $707,357 | $396,812 | $310,545 |
| 2015 | $7,671 | $696,733 | $390,852 | $305,881 |
| 2014 | $7,488 | $683,086 | $383,196 | $299,890 |
Source: Public Records
Map
Nearby Homes
- 18358 Locksley St
- 18304 Vezelay Ln
- 12434 Cloudesly Dr
- 12512 Cloudesly Dr
- 18557 Caminito Pasadero Unit 389
- 18577 Caminito Pasadero Unit 408
- 12564 Chetenham Ln
- 18614 Caminito Cantilena Unit 324
- 18600 Caminito Pasadero
- 18638 Caminito Pasadero
- 18650 Caminito Cantilena Unit 283
- 18650 Cantilena Unit 291
- 18761 Caminito Pasadero Unit 102
- 18680 Caminito Cantilena Unit 234
- 18640 Caminito Pasadero
- 18682 Lancashire Way
- 18771 Caminito Pasadero Unit 66
- 18752 Caminito Cantilena Unit 170
- 18752 Caminito Cantilena Unit 176
- 18782 Caminito Cantilena Unit 138
- 12337 Reata Ct
- 12357 Reata Ct
- 12346 Fernando Dr
- 12356 Fernando Dr
- 12336 Fernando Dr
- 12366 Fernando Dr
- 12338 Reata Ct
- 12367 Reata Ct Unit 24
- 12358 Reata Ct
- 12326 Fernando Dr
- 12348 Reata Ct
- 12376 Fernando Dr
- 18298 Fernando Way
- 12368 Reata Ct
- 12377 Reata Ct
- 12355 Fernando Dr
- 12316 Fernando Dr
- 12345 Fernando Dr
- 12365 Fernando Dr
- 12335 Fernando Dr