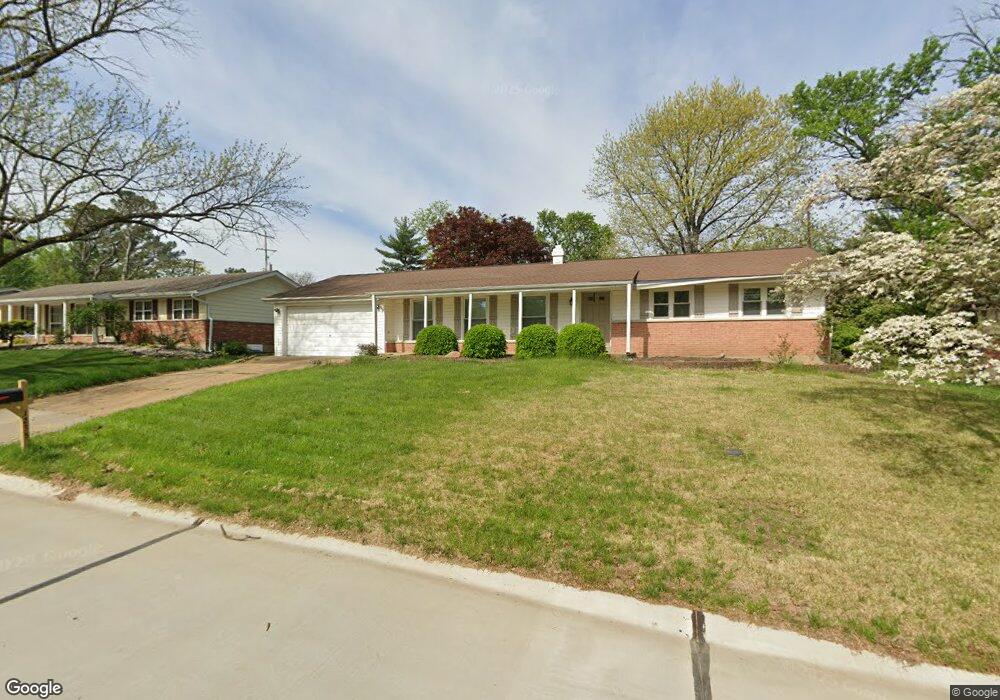
1235 Cedar Ridge Dr Saint Louis, MO 63146
Estimated Value: $336,691 - $396,000
3
Beds
2
Baths
1,683
Sq Ft
$217/Sq Ft
Est. Value
About This Home
This home is located at 1235 Cedar Ridge Dr, Saint Louis, MO 63146 and is currently estimated at $365,423, approximately $217 per square foot. 1235 Cedar Ridge Dr is a home located in St. Louis County with nearby schools including Ross Elementary School, Parkway Northeast Middle School, and Parkway North High School.
Ownership History
Date
Name
Owned For
Owner Type
Purchase Details
Closed on
Aug 3, 2012
Sold by
Brenner Jim and Brenner James A
Bought by
Oliver Joan Miles
Current Estimated Value
Purchase Details
Closed on
Oct 25, 2011
Sold by
Lyons Anthony M and Lyons Jennifer S
Bought by
Brenner Jim
Home Financials for this Owner
Home Financials are based on the most recent Mortgage that was taken out on this home.
Original Mortgage
$94,400
Interest Rate
4.13%
Mortgage Type
Future Advance Clause Open End Mortgage
Purchase Details
Closed on
May 17, 2004
Sold by
Desmet Teresa
Bought by
Lyons Anthony M
Home Financials for this Owner
Home Financials are based on the most recent Mortgage that was taken out on this home.
Original Mortgage
$185,000
Interest Rate
5.81%
Mortgage Type
Purchase Money Mortgage
Purchase Details
Closed on
Jul 28, 2003
Sold by
Desmet Teresa H
Bought by
Desmet Teresa and Teresa Desmet Revocable Trust
Create a Home Valuation Report for This Property
The Home Valuation Report is an in-depth analysis detailing your home's value as well as a comparison with similar homes in the area
Home Values in the Area
Average Home Value in this Area
Purchase History
| Date | Buyer | Sale Price | Title Company |
|---|---|---|---|
| Oliver Joan Miles | $186,355 | Continental Title Company | |
| Brenner Jim | $118,000 | None Available | |
| Lyons Anthony M | $185,000 | -- | |
| Desmet Teresa | -- | -- |
Source: Public Records
Mortgage History
| Date | Status | Borrower | Loan Amount |
|---|---|---|---|
| Previous Owner | Brenner Jim | $94,400 | |
| Previous Owner | Lyons Anthony M | $185,000 |
Source: Public Records
Tax History Compared to Growth
Tax History
| Year | Tax Paid | Tax Assessment Tax Assessment Total Assessment is a certain percentage of the fair market value that is determined by local assessors to be the total taxable value of land and additions on the property. | Land | Improvement |
|---|---|---|---|---|
| 2025 | $3,438 | $59,700 | $18,510 | $41,190 |
| 2024 | $3,438 | $52,480 | $13,870 | $38,610 |
| 2023 | $3,394 | $52,480 | $13,870 | $38,610 |
| 2022 | $3,363 | $47,410 | $13,870 | $33,540 |
| 2021 | $3,339 | $47,410 | $13,870 | $33,540 |
| 2020 | $3,158 | $42,810 | $15,920 | $26,890 |
| 2019 | $3,108 | $42,810 | $15,920 | $26,890 |
| 2018 | $2,907 | $36,940 | $12,030 | $24,910 |
| 2017 | $2,886 | $36,940 | $12,030 | $24,910 |
| 2016 | $2,856 | $34,770 | $9,250 | $25,520 |
| 2015 | $2,977 | $34,770 | $9,250 | $25,520 |
| 2014 | $2,602 | $32,440 | $9,920 | $22,520 |
Source: Public Records
Map
Nearby Homes
- 1311 Timber Run Dr
- 12812 Portulaca Dr Unit K
- 12929 Portulaca Dr Unit 310
- 12917 Portulaca Dr Unit 225
- 1157 Rue La Chelle Walk Unit 1157
- 1129 Rue La Ville Walk Unit 1129
- 12924 Autumn View Dr
- 12964 Autumn View Dr
- 1702 Pensacola Dr
- 13041 Tiger Lily Ct Unit 10
- 1444 Nancy Lee Dr
- 1014 Fernway Ln
- 1015 Fernway Ln
- 925 Maison Ladue Dr
- 12923 Somerton Ridge Dr
- 12930 Ferntop Ln
- 13033 King Arthur Spur
- 12818 Willowyck Dr
- 940 Fernview Dr
- 1324 Golden Point Dr
- 1231 Cedar Ridge Dr
- 12740 Cypressway Dr
- 1234 Cedar Ridge Dr
- 1227 Cedar Ridge Dr
- 1228 Cedar Ridge Dr
- 1223 Cedar Ridge Dr
- 12726 Cypressway Dr
- 12735 Cypressway Dr
- 12731 Cypressway Dr
- 12725 Karenway Ct
- 12739 Cypressway Dr
- 12725 Cypressway Dr
- 12720 Cypressway Dr
- 1219 Cedar Ridge Dr
- 12743 Cypressway Dr
- 12721 Karenway Ct
- 12719 Cypressway Dr
- 1218 Cedar Ridge Dr
- 12716 Cypressway Dr
- 1215 Cedar Ridge Dr