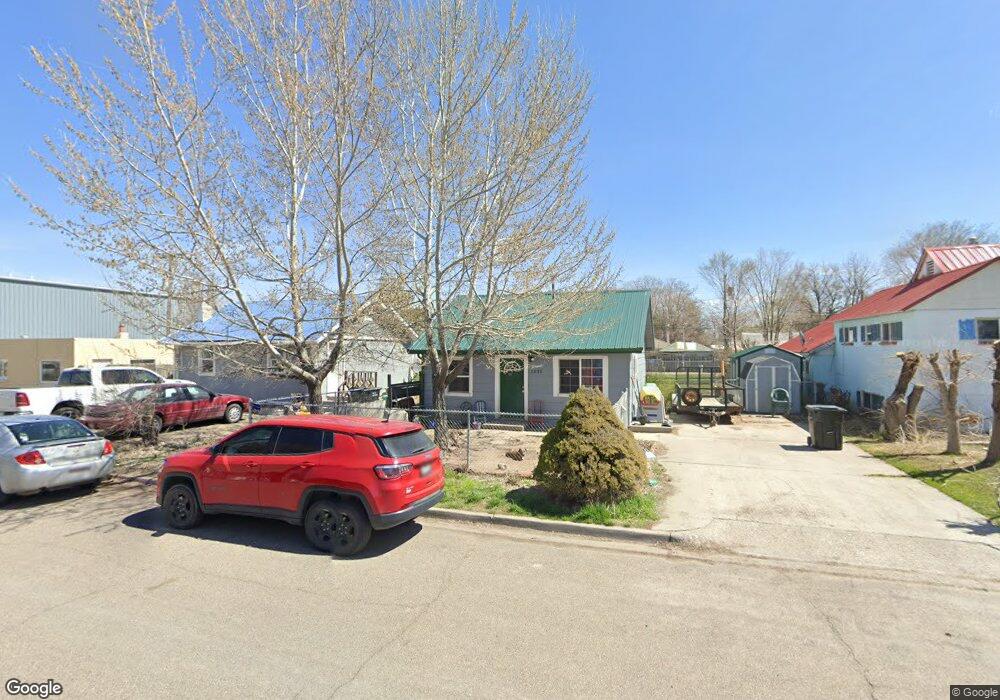
1235 Occidental Ave Burley, ID 83318
Estimated Value: $141,111 - $195,000
2
Beds
1
Bath
624
Sq Ft
$282/Sq Ft
Est. Value
About This Home
This home is located at 1235 Occidental Ave, Burley, ID 83318 and is currently estimated at $176,278, approximately $282 per square foot. 1235 Occidental Ave is a home located in Cassia County with nearby schools including White Pine Elementary School, Mountain View Elementary School, and Burley Junior High School.
Ownership History
Date
Name
Owned For
Owner Type
Purchase Details
Closed on
Oct 6, 2021
Sold by
Marconi Becki E and Stacy Becki E
Bought by
Stacy Dakota K
Current Estimated Value
Home Financials for this Owner
Home Financials are based on the most recent Mortgage that was taken out on this home.
Original Mortgage
$94,949
Outstanding Balance
$86,585
Interest Rate
2.8%
Mortgage Type
New Conventional
Estimated Equity
$89,693
Purchase Details
Closed on
Jul 28, 2011
Sold by
Nevarez Melyss
Bought by
Stacy Becki E
Home Financials for this Owner
Home Financials are based on the most recent Mortgage that was taken out on this home.
Original Mortgage
$38,986
Interest Rate
4.25%
Mortgage Type
FHA
Purchase Details
Closed on
Feb 1, 2006
Sold by
Federal National Mortgage Association
Bought by
Nevarez Melissa
Home Financials for this Owner
Home Financials are based on the most recent Mortgage that was taken out on this home.
Original Mortgage
$25,000
Interest Rate
6.15%
Mortgage Type
New Conventional
Create a Home Valuation Report for This Property
The Home Valuation Report is an in-depth analysis detailing your home's value as well as a comparison with similar homes in the area
Home Values in the Area
Average Home Value in this Area
Purchase History
| Date | Buyer | Sale Price | Title Company |
|---|---|---|---|
| Stacy Dakota K | -- | Titleone Twin Falls | |
| Stacy Becki E | -- | -- | |
| Nevarez Melyssa | -- | -- | |
| Nevarez Melissa | -- | None Available |
Source: Public Records
Mortgage History
| Date | Status | Borrower | Loan Amount |
|---|---|---|---|
| Open | Stacy Dakota K | $94,949 | |
| Closed | Stacy Becki E | $38,986 | |
| Previous Owner | Nevarez Melissa | $25,000 |
Source: Public Records
Tax History Compared to Growth
Tax History
| Year | Tax Paid | Tax Assessment Tax Assessment Total Assessment is a certain percentage of the fair market value that is determined by local assessors to be the total taxable value of land and additions on the property. | Land | Improvement |
|---|---|---|---|---|
| 2024 | $323 | $62,692 | $30,982 | $31,710 |
| 2023 | $335 | $62,712 | $30,982 | $31,730 |
| 2022 | $323 | $46,992 | $14,284 | $32,708 |
| 2021 | $356 | $41,268 | $14,284 | $26,984 |
| 2020 | $356 | $37,565 | $10,581 | $26,984 |
| 2019 | $349 | $36,183 | $9,983 | $26,200 |
| 2017 | $327 | $32,128 | $9,075 | $23,053 |
| 2016 | $320 | $31,377 | $9,075 | $22,302 |
| 2015 | $314 | $30,552 | $8,250 | $22,302 |
| 2014 | $310 | $30,552 | $8,250 | $22,302 |
| 2013 | $310 | $30,552 | $8,250 | $22,302 |
Source: Public Records
Map
Nearby Homes
- 221 W Main St
- 1610 Burton Ave
- 1501 Miller Ave Unit 3
- 1401 Oakley Ave
- 8 E Island Ct
- 1729 Yale Ave
- 1719 Burton Ave
- 1327 Hansen Ave
- 1942 Burton Ave
- 1600 Hansen Ave
- 201 W 19th St
- 502 E 13th St
- 1051 Almo Ave
- 1250 Elba Ave
- 1519 Almo Ave
- 2140 Daven Place
- 2431 Dorchester Ave
- 1635 Elba Ave
- 542 Normal Ave
- 500 E 19th St
- 1227 Occidental Ave
- 1243 Occidental Ave
- 1221 Occidental Ave
- 1259 Occidental Ave
- 1234 Yale Ave
- 1242 Yale Ave
- 727 W Main St
- 1250 Yale Ave
- 700 W 13th St
- 1234 Occidental Ave
- 1226 Occidental Ave
- 1258 Occidental Ave
- 1101 Occidental Ave
- 817 W Main St
- 1226 Park Ave
- 1268 Park Ave
- 1235 Yale Ave
- 1227 Yale Ave
- 1361 Park Ave
- 628 W 13th St