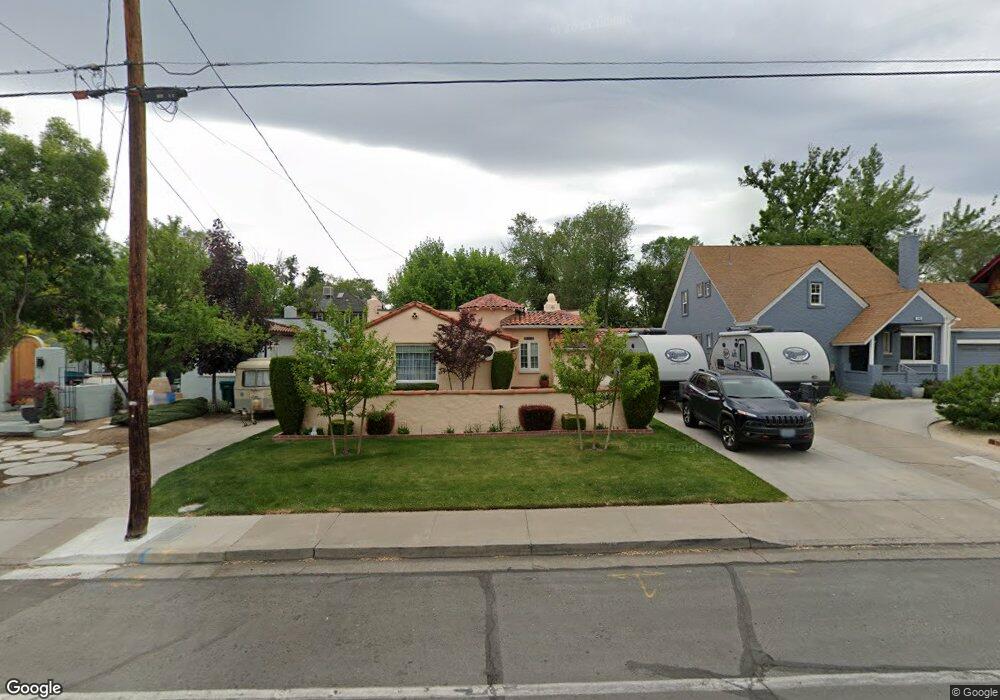
1235 S Arlington Ave Reno, NV 89509
Hunter Lake NeighborhoodEstimated Value: $682,000 - $752,264
3
Beds
2
Baths
1,611
Sq Ft
$436/Sq Ft
Est. Value
About This Home
This home is located at 1235 S Arlington Ave, Reno, NV 89509 and is currently estimated at $702,566, approximately $436 per square foot. 1235 S Arlington Ave is a home located in Washoe County with nearby schools including Mount Rose K-8 School of Languages, Darrell C Swope Middle School, and Reno High School.
Ownership History
Date
Name
Owned For
Owner Type
Purchase Details
Closed on
Aug 12, 1997
Sold by
Wagner Kirk R and Wagner Gabrielle Sackett
Bought by
Elswick John A and Elswick Barbara E
Current Estimated Value
Home Financials for this Owner
Home Financials are based on the most recent Mortgage that was taken out on this home.
Original Mortgage
$168,150
Outstanding Balance
$23,297
Interest Rate
7.61%
Estimated Equity
$679,269
Purchase Details
Closed on
May 30, 1995
Sold by
Peek J Stephen
Bought by
Wagner Kirk K and Wagner Gabrielle Sackett
Home Financials for this Owner
Home Financials are based on the most recent Mortgage that was taken out on this home.
Original Mortgage
$142,500
Interest Rate
8.43%
Create a Home Valuation Report for This Property
The Home Valuation Report is an in-depth analysis detailing your home's value as well as a comparison with similar homes in the area
Home Values in the Area
Average Home Value in this Area
Purchase History
| Date | Buyer | Sale Price | Title Company |
|---|---|---|---|
| Elswick John A | $177,000 | Stewart Title | |
| Wagner Kirk K | $162,500 | First American Title Company | |
| Peek J Stephen | -- | First American Title Company |
Source: Public Records
Mortgage History
| Date | Status | Borrower | Loan Amount |
|---|---|---|---|
| Open | Elswick John A | $168,150 | |
| Previous Owner | Wagner Kirk K | $142,500 |
Source: Public Records
Tax History Compared to Growth
Tax History
| Year | Tax Paid | Tax Assessment Tax Assessment Total Assessment is a certain percentage of the fair market value that is determined by local assessors to be the total taxable value of land and additions on the property. | Land | Improvement |
|---|---|---|---|---|
| 2026 | $1,207 | $89,361 | $49,385 | $39,976 |
| 2025 | $1,570 | $88,580 | $48,794 | $39,787 |
| 2024 | $1,570 | $86,590 | $47,408 | $39,182 |
| 2023 | $1,525 | $83,596 | $47,408 | $36,189 |
| 2022 | $1,486 | $67,562 | $38,084 | $29,478 |
| 2021 | $1,555 | $58,740 | $29,925 | $28,815 |
| 2020 | $1,508 | $58,262 | $29,925 | $28,337 |
| 2019 | $1,463 | $55,740 | $28,350 | $27,390 |
| 2018 | $1,422 | $48,636 | $22,400 | $26,236 |
| 2017 | $1,380 | $48,198 | $22,400 | $25,798 |
| 2016 | $1,344 | $52,069 | $26,600 | $25,469 |
| 2015 | $338 | $40,382 | $15,794 | $24,588 |
| 2014 | $1,281 | $38,461 | $14,963 | $23,498 |
| 2013 | -- | $34,458 | $11,750 | $22,708 |
Source: Public Records
Map
Nearby Homes
- 1410 Patrick Ave
- 1217 Lander St
- 1001 Lander St
- 1264 Humboldt St
- 255 Circle Dr
- 650 John Fremont Dr
- 30 W Taylor St
- 410 Reno Ave
- 1170 Forest St
- 343 Mount Rose St
- 343 & 347 Mount Rose St St
- 222 W Arroyo St Unit 2
- 590 Saint Lawrence Ave
- 1633 Knox Ave
- 1175 Fairfield Ave
- 0 California Ave Unit 250054017
- 0 California Ave Unit 250053123
- 0 California Ave Unit 250053399
- 619 Marsh Ave
- 395 Chevy Chase St
- 1239 S Arlington Ave
- 1233 S Arlington Ave
- 1245 S Arlington Ave
- 1231 S Arlington Ave
- 1255 W Arroyo St
- 1270 Gordon Ave
- 1250 Gordon Ave
- 1255 S Arlington Ave
- 1229 S Arlington Ave
- 1222 Gordon Ave
- 1310 Gordon Ave
- 1218 Gordon Ave
- 1236 S Arlington Ave
- 1216 Gordon Ave
- 695 W Arroyo St
- 1340 Gordon Ave
- 1234 S Arlington Ave
- 1306 S Arlington Ave
- 1232 S Arlington Ave
- 1225 S Arlington Ave