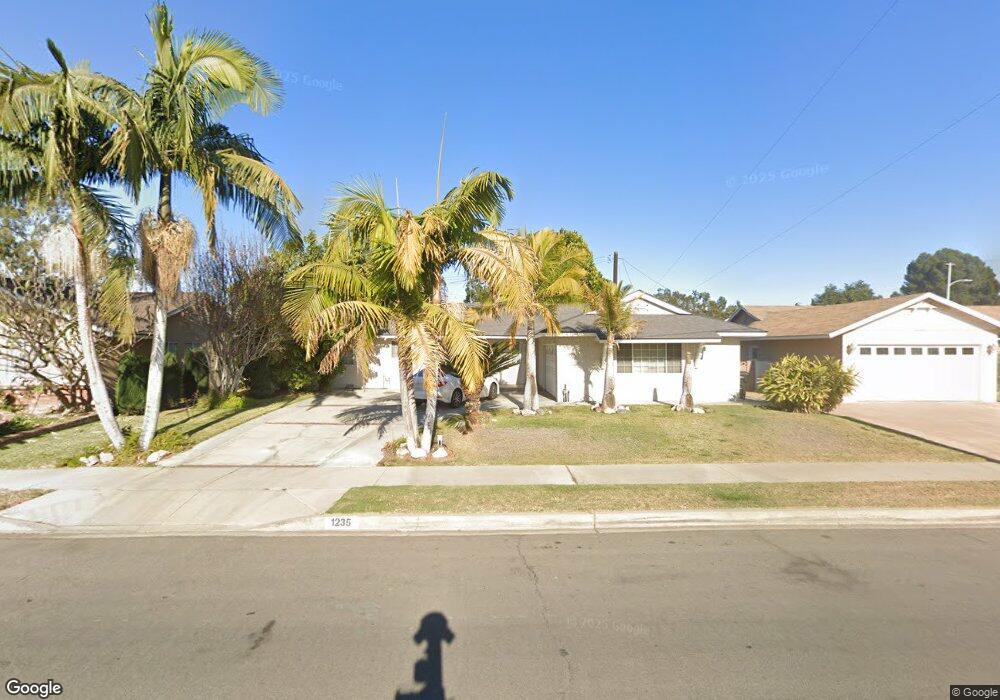
1235 W Service Ave West Covina, CA 91790
Estimated Value: $907,000 - $1,243,000
4
Beds
3
Baths
2,360
Sq Ft
$430/Sq Ft
Est. Value
About This Home
This home is located at 1235 W Service Ave, West Covina, CA 91790 and is currently estimated at $1,015,715, approximately $430 per square foot. 1235 W Service Ave is a home located in Los Angeles County with nearby schools including Wescove Elementary School, Walnut Grove Intermediate School, and Edgewood High School.
Ownership History
Date
Name
Owned For
Owner Type
Purchase Details
Closed on
Nov 2, 2001
Sold by
Pham Joseph
Bought by
Ngo Thang Q and Ngo Tuan Q
Current Estimated Value
Home Financials for this Owner
Home Financials are based on the most recent Mortgage that was taken out on this home.
Original Mortgage
$225,000
Interest Rate
6.63%
Purchase Details
Closed on
May 27, 1998
Sold by
Cuenca Jaime
Bought by
Pham Trung Quoc
Home Financials for this Owner
Home Financials are based on the most recent Mortgage that was taken out on this home.
Original Mortgage
$152,100
Interest Rate
6.93%
Purchase Details
Closed on
Oct 18, 1993
Sold by
Cuenca Jaime
Bought by
Cuenca Jaime and Cuenca Ventura E
Home Financials for this Owner
Home Financials are based on the most recent Mortgage that was taken out on this home.
Original Mortgage
$157,500
Interest Rate
6.95%
Create a Home Valuation Report for This Property
The Home Valuation Report is an in-depth analysis detailing your home's value as well as a comparison with similar homes in the area
Home Values in the Area
Average Home Value in this Area
Purchase History
| Date | Buyer | Sale Price | Title Company |
|---|---|---|---|
| Ngo Thang Q | $281,500 | Stewart Title | |
| Pham Trung Quoc | $169,000 | Chicago Title Insurance Co | |
| Cuenca Jaime | -- | Fidelity National Title |
Source: Public Records
Mortgage History
| Date | Status | Borrower | Loan Amount |
|---|---|---|---|
| Closed | Ngo Thang Q | $225,000 | |
| Previous Owner | Pham Trung Quoc | $152,100 | |
| Previous Owner | Cuenca Jaime | $157,500 |
Source: Public Records
Tax History Compared to Growth
Tax History
| Year | Tax Paid | Tax Assessment Tax Assessment Total Assessment is a certain percentage of the fair market value that is determined by local assessors to be the total taxable value of land and additions on the property. | Land | Improvement |
|---|---|---|---|---|
| 2025 | $5,348 | $415,838 | $194,106 | $221,732 |
| 2024 | $5,348 | $407,685 | $190,300 | $217,385 |
| 2023 | $5,089 | $399,692 | $186,569 | $213,123 |
| 2022 | $5,128 | $391,856 | $182,911 | $208,945 |
| 2021 | $4,980 | $384,174 | $179,325 | $204,849 |
| 2019 | $4,848 | $372,781 | $174,007 | $198,774 |
| 2018 | $4,612 | $365,473 | $170,596 | $194,877 |
| 2016 | $4,209 | $351,282 | $163,972 | $187,310 |
| 2015 | $4,126 | $346,006 | $161,509 | $184,497 |
| 2014 | $4,103 | $339,229 | $158,346 | $180,883 |
Source: Public Records
Map
Nearby Homes
- 1217 W Barbara Ave
- 1530 W Cameron Ave
- 711 Hudson Ln
- 1736 Cayton Loop
- 1752 Cayton Loop
- 154 N Roberto Ave
- 1553 Dennis Place
- 836 W Barbara Ave
- 234 N Sunset Ave
- 1308 W Lighthall St
- 1814 Seattle St
- 120 Poxon Place
- 944 S Russelee Dr
- 944 S Sharonlee Dr
- 1019 W Pine St
- 709 S Valinda Ave
- 427 N Walnuthaven Dr
- 920 E Herring Ave
- 434 N Orange Ave
- 1818 W Merced Ave
- 1227 W Service Ave
- 1305 W Service Ave
- 663 S Broadmoor Ave
- 704 S Carmencita Dr
- 1228 W Service Ave
- 659 S Broadmoor Ave
- 666 S Broadmoor Ave
- 1220 W Service Ave
- 705 S Carmencita Dr
- 1237 W Camila Rd
- 1233 W Camila Rd
- 660 S Broadmoor Ave
- 1214 W Service Ave
- 655 S Broadmoor Ave
- 1229 W Camila Rd
- 1211 W Service Ave
- 1221 W Camila Rd
- 711 S Carmencita Dr
- 1208 W Service Ave
- 656 S Broadmoor Ave