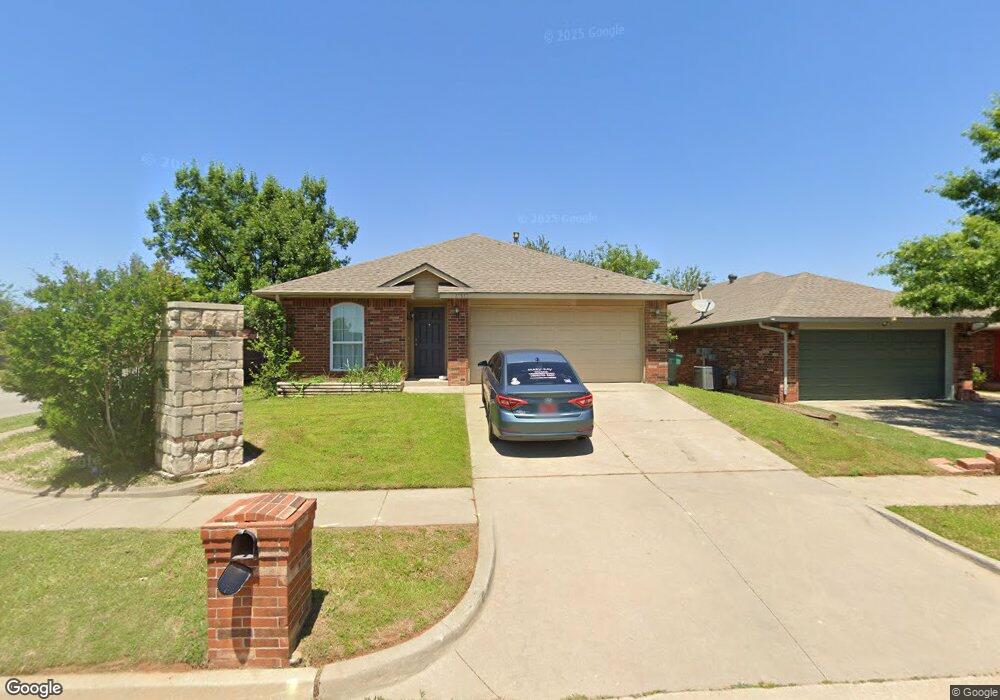
12357 SW 3rd St Yukon, OK 73099
Westgate NeighborhoodEstimated Value: $207,000 - $217,000
3
Beds
2
Baths
1,416
Sq Ft
$151/Sq Ft
Est. Value
About This Home
This home is located at 12357 SW 3rd St, Yukon, OK 73099 and is currently estimated at $213,613, approximately $150 per square foot. 12357 SW 3rd St is a home located in Canadian County with nearby schools including Mustang Trails Elementary School, Meadow Brook Intermediate School, and Mustang Central Middle School.
Ownership History
Date
Name
Owned For
Owner Type
Purchase Details
Closed on
Sep 17, 2010
Sold by
The Secretary Of Veterans Affairs
Bought by
Mazella Frank W and Mazella Lori A
Current Estimated Value
Home Financials for this Owner
Home Financials are based on the most recent Mortgage that was taken out on this home.
Original Mortgage
$102,600
Interest Rate
4.27%
Mortgage Type
VA
Purchase Details
Closed on
Aug 9, 2010
Sold by
Pierce Michael S
Bought by
Secretary Of Veterans Affairs
Home Financials for this Owner
Home Financials are based on the most recent Mortgage that was taken out on this home.
Original Mortgage
$102,600
Interest Rate
4.27%
Mortgage Type
VA
Purchase Details
Closed on
Mar 17, 2006
Sold by
High Strive Constructions Lp
Bought by
Pierce Michael S and Pierce Stacey L
Home Financials for this Owner
Home Financials are based on the most recent Mortgage that was taken out on this home.
Original Mortgage
$123,090
Interest Rate
6.21%
Mortgage Type
New Conventional
Create a Home Valuation Report for This Property
The Home Valuation Report is an in-depth analysis detailing your home's value as well as a comparison with similar homes in the area
Home Values in the Area
Average Home Value in this Area
Purchase History
| Date | Buyer | Sale Price | Title Company |
|---|---|---|---|
| Mazella Frank W | $108,000 | Multiple | |
| Secretary Of Veterans Affairs | -- | Fatco | |
| Pierce Michael S | $120,500 | Fatco |
Source: Public Records
Mortgage History
| Date | Status | Borrower | Loan Amount |
|---|---|---|---|
| Previous Owner | Mazella Frank W | $102,600 | |
| Previous Owner | Pierce Michael S | $123,090 |
Source: Public Records
Tax History Compared to Growth
Tax History
| Year | Tax Paid | Tax Assessment Tax Assessment Total Assessment is a certain percentage of the fair market value that is determined by local assessors to be the total taxable value of land and additions on the property. | Land | Improvement |
|---|---|---|---|---|
| 2024 | $2,123 | $19,686 | $1,800 | $17,886 |
| 2023 | $2,123 | $18,748 | $1,800 | $16,948 |
| 2022 | $2,052 | $17,856 | $1,800 | $16,056 |
| 2021 | $1,947 | $17,006 | $1,800 | $15,206 |
| 2020 | $1,912 | $16,526 | $1,800 | $14,726 |
| 2019 | $1,819 | $15,739 | $1,800 | $13,939 |
| 2018 | $1,764 | $14,990 | $1,800 | $13,190 |
| 2017 | $1,758 | $15,133 | $1,800 | $13,333 |
| 2016 | $1,704 | $14,901 | $1,800 | $13,101 |
| 2015 | $1,750 | $14,005 | $1,800 | $12,205 |
| 2014 | $1,750 | $14,984 | $1,800 | $13,184 |
Source: Public Records
Map
Nearby Homes
- 517 Cherokee Gate Dr
- 12824 NW 4th Terrace
- 12616 NW 1st Terrace
- 418 Palo Verde Dr
- 12127 SW 4th St
- 13 Evermore Ln
- 213 Harrogate Dr
- 12517 Park Ave
- 212 Sage Brush Rd
- 209 Bradgate Dr
- 904 Norway Ave
- 12328 SW 9th Terrace
- 24 Carat Dr
- 304 Bradgate Dr
- 12729 NW 2nd St
- 321 Bradgate Dr
- 121 Pawnee Place
- 624 Caladium Dr
- 400 Haven St
- 12320 NW 4th St
- 12353 SW 3rd St
- 12349 SW 3rd St
- 12401 SW 3rd St
- 12345 SW 3rd St
- 12336 SW 2nd St
- 401 Cherokee Gate Dr
- 12334 SW 2nd St
- 12403 SW 3rd St
- 12332 SW 2nd St
- 12338 SW 2nd St
- 12341 SW 3rd St
- 12400 SW 2nd St
- 405 Cherokee Gate Dr
- 12405 SW 3rd St
- 12402 SW 2nd St
- 12330 SW 2nd St
- 12328 SW 2nd St
- 12400 SW 3rd St
- 12337 SW 3rd St
- 12402 SW 3rd St