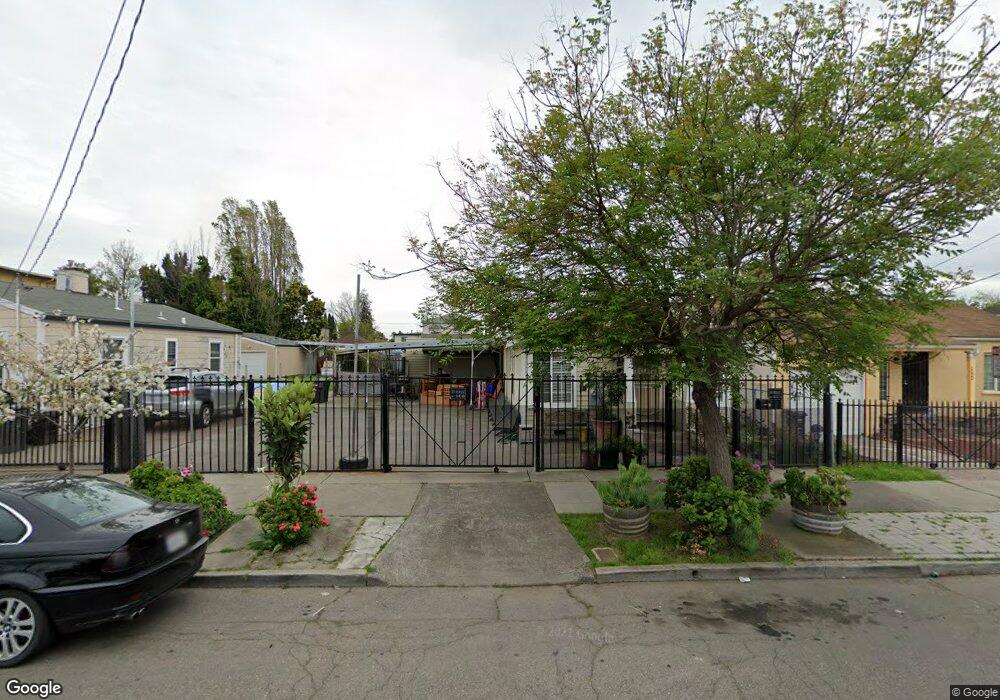
1236 86th Ave Oakland, CA 94621
Highland NeighborhoodEstimated Value: $329,427 - $434,000
2
Beds
1
Bath
620
Sq Ft
$597/Sq Ft
Est. Value
About This Home
This home is located at 1236 86th Ave, Oakland, CA 94621 and is currently estimated at $369,857, approximately $596 per square foot. 1236 86th Ave is a home located in Alameda County with nearby schools including New Highland Academy, Acorn Woodland Elementary School, and Encompass Academy Elementary.
Ownership History
Date
Name
Owned For
Owner Type
Purchase Details
Closed on
Jun 19, 2019
Sold by
Martinez Rosalio and Martinez Julia L
Bought by
Martinez Rosalio and Martinez Julia L
Current Estimated Value
Purchase Details
Closed on
Aug 5, 2005
Sold by
Haugabook Ronald V
Bought by
Duenas Octavio and Duenas Blanca
Home Financials for this Owner
Home Financials are based on the most recent Mortgage that was taken out on this home.
Original Mortgage
$360,000
Outstanding Balance
$186,676
Interest Rate
5.46%
Mortgage Type
Fannie Mae Freddie Mac
Estimated Equity
$183,181
Create a Home Valuation Report for This Property
The Home Valuation Report is an in-depth analysis detailing your home's value as well as a comparison with similar homes in the area
Home Values in the Area
Average Home Value in this Area
Purchase History
| Date | Buyer | Sale Price | Title Company |
|---|---|---|---|
| Martinez Rosalio | -- | None Available | |
| Duenas Octavio | $360,000 | -- |
Source: Public Records
Mortgage History
| Date | Status | Borrower | Loan Amount |
|---|---|---|---|
| Open | Duenas Octavio | $360,000 |
Source: Public Records
Tax History
| Year | Tax Paid | Tax Assessment Tax Assessment Total Assessment is a certain percentage of the fair market value that is determined by local assessors to be the total taxable value of land and additions on the property. | Land | Improvement |
|---|---|---|---|---|
| 2025 | $2,817 | $78,380 | $23,514 | $54,866 |
| 2024 | $2,817 | $76,844 | $23,053 | $53,791 |
| 2023 | $2,831 | $75,337 | $22,601 | $52,736 |
| 2022 | $2,685 | $73,860 | $22,158 | $51,702 |
| 2021 | $2,411 | $72,412 | $21,723 | $50,689 |
| 2020 | $2,382 | $71,670 | $21,501 | $50,169 |
| 2019 | $2,195 | $70,264 | $21,079 | $49,185 |
| 2018 | $2,153 | $68,887 | $20,666 | $48,221 |
| 2017 | $2,035 | $67,537 | $20,261 | $47,276 |
| 2016 | $1,875 | $66,213 | $19,864 | $46,349 |
| 2015 | $1,860 | $65,218 | $19,565 | $45,653 |
| 2014 | $1,765 | $63,941 | $19,182 | $44,759 |
Source: Public Records
Map
Nearby Homes
Your Personal Tour Guide
Ask me questions while you tour the home.