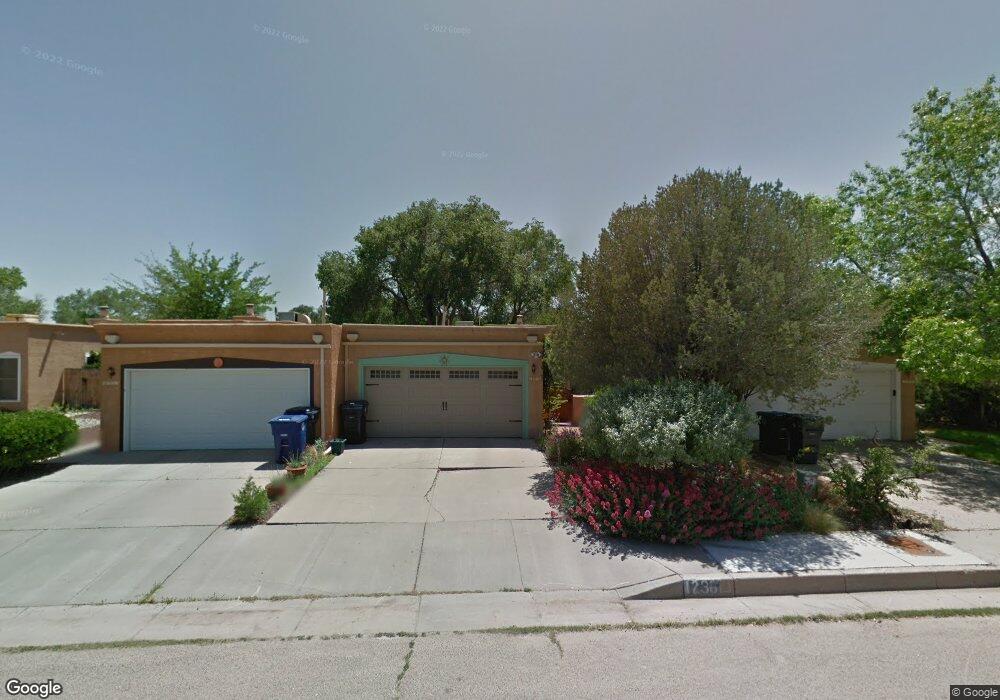
1236 Don Francisco Place NW Albuquerque, NM 87107
Near North Valley NeighborhoodEstimated Value: $294,000 - $329,000
2
Beds
2
Baths
1,292
Sq Ft
$242/Sq Ft
Est. Value
About This Home
This home is located at 1236 Don Francisco Place NW, Albuquerque, NM 87107 and is currently estimated at $312,719, approximately $242 per square foot. 1236 Don Francisco Place NW is a home located in Bernalillo County with nearby schools including Cochiti Elementary School, Garfield Middle, and Valley High School.
Ownership History
Date
Name
Owned For
Owner Type
Purchase Details
Closed on
Mar 27, 2024
Sold by
Talbot Rita G
Bought by
Slimp Stephanie
Current Estimated Value
Home Financials for this Owner
Home Financials are based on the most recent Mortgage that was taken out on this home.
Original Mortgage
$254,340
Outstanding Balance
$250,460
Interest Rate
6.77%
Mortgage Type
VA
Estimated Equity
$62,259
Purchase Details
Closed on
Sep 26, 2008
Sold by
Harrington Connie S
Bought by
Talbot Rita G
Purchase Details
Closed on
Nov 30, 2006
Sold by
Mcpherson Linda S
Bought by
Harrington Connie
Purchase Details
Closed on
Jun 22, 2005
Sold by
Menter Pamela
Bought by
Mcpherson Linda S
Purchase Details
Closed on
Apr 17, 2003
Sold by
Cole Gordon E and Cole Marjorie M
Bought by
Menter Pamela
Home Financials for this Owner
Home Financials are based on the most recent Mortgage that was taken out on this home.
Original Mortgage
$139,806
Interest Rate
5.64%
Mortgage Type
FHA
Create a Home Valuation Report for This Property
The Home Valuation Report is an in-depth analysis detailing your home's value as well as a comparison with similar homes in the area
Home Values in the Area
Average Home Value in this Area
Purchase History
| Date | Buyer | Sale Price | Title Company |
|---|---|---|---|
| Slimp Stephanie | -- | Fidelity National Title | |
| Talbot Rita G | -- | None Available | |
| Harrington Connie | -- | Landamerica-Albuquerque Titl | |
| Mcpherson Linda S | -- | Albqu Title Co | |
| Menter Pamela | -- | -- |
Source: Public Records
Mortgage History
| Date | Status | Borrower | Loan Amount |
|---|---|---|---|
| Open | Slimp Stephanie | $254,340 | |
| Previous Owner | Menter Pamela | $139,806 |
Source: Public Records
Tax History Compared to Growth
Tax History
| Year | Tax Paid | Tax Assessment Tax Assessment Total Assessment is a certain percentage of the fair market value that is determined by local assessors to be the total taxable value of land and additions on the property. | Land | Improvement |
|---|---|---|---|---|
| 2024 | $2,752 | $57,029 | $14,379 | $42,650 |
| 2023 | $2,702 | $55,368 | $13,960 | $41,408 |
| 2022 | $2,559 | $53,756 | $13,554 | $40,202 |
| 2021 | $2,474 | $52,190 | $13,159 | $39,031 |
| 2020 | $2,430 | $50,671 | $12,776 | $37,895 |
| 2019 | $2,359 | $49,195 | $12,404 | $36,791 |
| 2018 | $2,277 | $49,195 | $12,404 | $36,791 |
| 2017 | $2,196 | $47,762 | $12,043 | $35,719 |
| 2016 | $2,122 | $45,021 | $11,352 | $33,669 |
| 2015 | $43,711 | $43,711 | $11,022 | $32,689 |
| 2014 | $1,979 | $42,438 | $10,701 | $31,737 |
| 2013 | -- | $41,202 | $10,389 | $30,813 |
Source: Public Records
Map
Nearby Homes
- 1301 Valle Ln NW
- 1010 Aztec Rd NW
- 4011 Broadview Place NW
- 4208 Trinity Place NW
- 2913 8th St NW
- 1423 Van Cleave Rd NW
- 615 Los Arboles Ave NW
- 3103 Los Tomases Dr NW
- 1604 Los Arboles Ave NW
- 503 Aztec Rd NW
- 425 Fitzgerald Rd NW
- 4502 16th Ct NW
- 828 San Clemente Ave NW
- 2817 Indian Farm Ln NW
- 614 San Lorenzo Ave NW
- 4516 Grande Dr NW
- 2920 San Isidro St NW
- 1619 McDonald Rd NW
- 435 Cordova Ave NW
- 424 Cordova Ave NW
- 1232 Don Francisco Place NW
- 1244 Don Francisco Place NW
- 1228 Don Francisco Place NW
- 1224 Don Francisco Place NW
- 1248 Don Francisco Place NW
- 1220 Don Francisco Place NW
- 1237 Don Francisco Place NW
- 1233 Don Francisco Place NW
- 1229 Don Francisco Place NW
- 1225 Don Francisco Place NW
- 1216 Don Francisco Place NW
- 1245 Don Francisco Place NW
- 1256 Don Francisco Place NW
- 1252 Don Francisco Place NW
- 1249 Don Francisco Place NW
- 1221 Don Francisco Place NW
- 1212 Don Francisco Place NW
- 1217 Don Francisco Place NW
- 1208 Don Francisco Place NW
- 3541 12th St NW