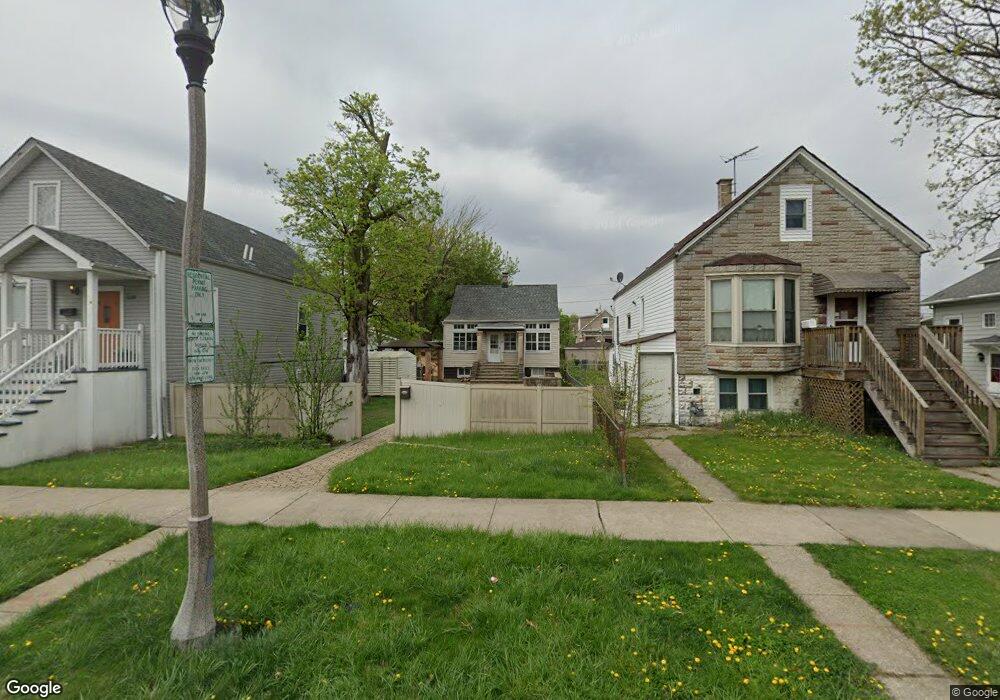
1236 Gunderson Ave Berwyn, IL 60402
Estimated Value: $243,000 - $327,329
2
Beds
2
Baths
671
Sq Ft
$414/Sq Ft
Est. Value
About This Home
This home is located at 1236 Gunderson Ave, Berwyn, IL 60402 and is currently estimated at $277,582, approximately $413 per square foot. 1236 Gunderson Ave is a home located in Cook County with nearby schools including Prairie Oak School, Lincoln Middle School, and J Sterling Morton West High School.
Ownership History
Date
Name
Owned For
Owner Type
Purchase Details
Closed on
Jun 28, 2006
Sold by
Lopez Esperanza
Bought by
Ruiz Carolina
Current Estimated Value
Home Financials for this Owner
Home Financials are based on the most recent Mortgage that was taken out on this home.
Original Mortgage
$159,920
Interest Rate
7.95%
Mortgage Type
Balloon
Purchase Details
Closed on
Sep 11, 2002
Sold by
Aguirre Esperanza
Bought by
Lopez Esperanza
Purchase Details
Closed on
Nov 22, 2000
Sold by
Piecuch Shelly L
Bought by
Aguirre Esperanza
Home Financials for this Owner
Home Financials are based on the most recent Mortgage that was taken out on this home.
Original Mortgage
$109,250
Interest Rate
7.8%
Purchase Details
Closed on
Mar 10, 2000
Sold by
Hud
Bought by
Piecuch Shelly L
Home Financials for this Owner
Home Financials are based on the most recent Mortgage that was taken out on this home.
Original Mortgage
$66,500
Interest Rate
8.12%
Create a Home Valuation Report for This Property
The Home Valuation Report is an in-depth analysis detailing your home's value as well as a comparison with similar homes in the area
Home Values in the Area
Average Home Value in this Area
Purchase History
| Date | Buyer | Sale Price | Title Company |
|---|---|---|---|
| Ruiz Carolina | $200,000 | Multiple | |
| Lopez Esperanza | -- | -- | |
| Aguirre Esperanza | $115,000 | -- | |
| Piecuch Shelly L | -- | Stewart Title |
Source: Public Records
Mortgage History
| Date | Status | Borrower | Loan Amount |
|---|---|---|---|
| Previous Owner | Ruiz Carolina | $159,920 | |
| Previous Owner | Aguirre Esperanza | $109,250 | |
| Previous Owner | Piecuch Shelly L | $66,500 |
Source: Public Records
Tax History Compared to Growth
Tax History
| Year | Tax Paid | Tax Assessment Tax Assessment Total Assessment is a certain percentage of the fair market value that is determined by local assessors to be the total taxable value of land and additions on the property. | Land | Improvement |
|---|---|---|---|---|
| 2024 | $6,503 | $24,000 | $5,316 | $18,684 |
| 2023 | $3,551 | $24,000 | $5,316 | $18,684 |
| 2022 | $3,551 | $12,282 | $4,607 | $7,675 |
| 2021 | $3,416 | $12,280 | $4,606 | $7,674 |
| 2020 | $3,412 | $12,280 | $4,606 | $7,674 |
| 2019 | $3,394 | $11,658 | $4,134 | $7,524 |
| 2018 | $3,258 | $11,658 | $4,134 | $7,524 |
| 2017 | $3,180 | $11,658 | $4,134 | $7,524 |
| 2016 | $3,751 | $11,365 | $3,425 | $7,940 |
| 2015 | $3,628 | $11,365 | $3,425 | $7,940 |
| 2014 | $2,809 | $11,365 | $3,425 | $7,940 |
| 2013 | $3,835 | $13,322 | $3,425 | $9,897 |
Source: Public Records
Map
Nearby Homes
- 1233 Gunderson Ave
- 1321 East Ave
- 1243 Elmwood Ave
- 1183 S Scoville Ave
- 1223 S Elmwood Ave Unit TWO
- 1157 Gunderson Ave
- 1335 Wesley Ave
- 1222 Cuyler Ave
- 6337 Roosevelt Rd Unit 103
- 6337 Roosevelt Rd Unit 309
- 6337 Roosevelt Rd Unit 107
- 6337 Roosevelt Rd Unit 308
- 1429 Gunderson Ave
- 1336 Cuyler Ave
- 1435 Gunderson Ave
- 1336 Wesley Ave
- 1345 S Cuyler Ave
- 1510 Scoville Ave
- 1413 Cuyler Ave
- 1241 Highland Ave
- 1238 Gunderson Ave
- 1232 Gunderson Ave
- 1240 Gunderson Ave
- 1228 Gunderson Ave
- 1242 Gunderson Ave
- 1244 Gunderson Ave
- 1246 Gunderson Ave
- 1237 Scoville Ave
- 1224 Gunderson Ave
- 1233 Scoville Ave
- 1241 Scoville Ave
- 1231 Scoville Ave
- 1243 Scoville Ave
- 1227 Scoville Ave
- 1245 Scoville Ave
- 1243 Gunderson Ave
- 1237 Gunderson Ave
- 1235 Gunderson Ave
- 1239 Gunderson Ave
- 1220 Gunderson Ave