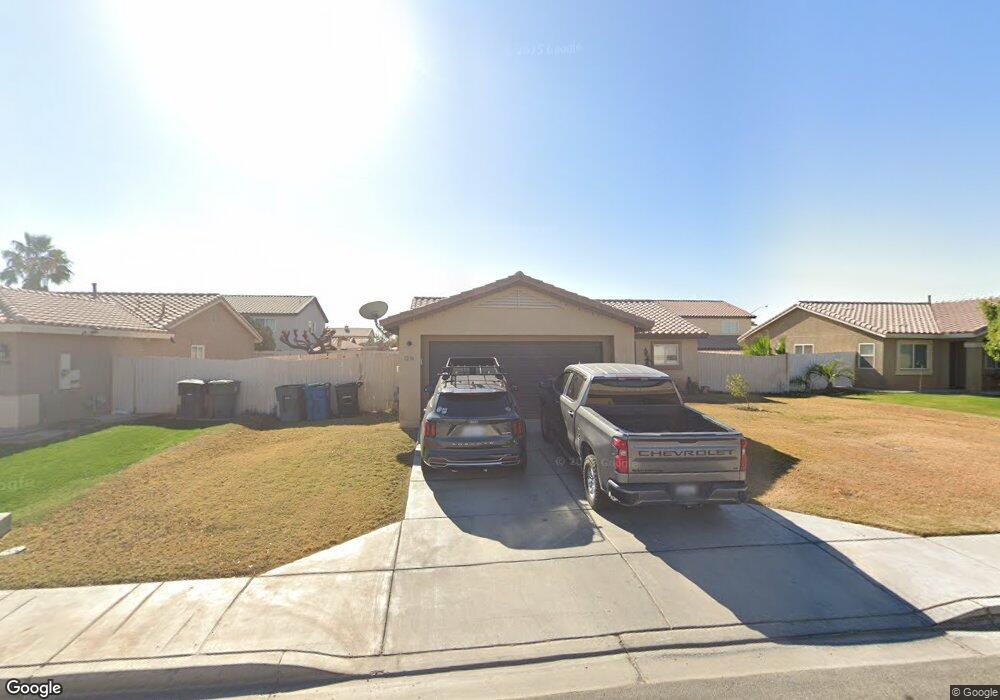
1236 Sereno Dr Calexico, CA 92231
Estimated Value: $395,000 - $467,000
3
Beds
2
Baths
1,393
Sq Ft
$304/Sq Ft
Est. Value
About This Home
This home is located at 1236 Sereno Dr, Calexico, CA 92231 and is currently estimated at $424,117, approximately $304 per square foot. 1236 Sereno Dr is a home located in Imperial County with nearby schools including Jefferson Elementary School, Enrique Camarena Junior High School, and Calexico High School.
Ownership History
Date
Name
Owned For
Owner Type
Purchase Details
Closed on
May 12, 2012
Sold by
Landa Inocencio and Landa Miguel Angel
Bought by
Landa Inocencio
Current Estimated Value
Purchase Details
Closed on
Oct 26, 2010
Sold by
The Secretary Of Housing & Urban Develop
Bought by
Landa Inocencio and Landa Miguel Angel
Purchase Details
Closed on
Sep 20, 2010
Sold by
Landa Marina
Bought by
Landa Inocencio
Purchase Details
Closed on
Feb 19, 2010
Sold by
Bac Home Loans Servicing Lp
Bought by
The Secretary Of Housing & Urban Develop
Purchase Details
Closed on
Feb 18, 2010
Sold by
Llanes Jose Hector
Bought by
Bac Home Loans Servicing Lp
Purchase Details
Closed on
Apr 14, 2008
Sold by
Sereno Residential Investors Llc
Bought by
Llanes Jose Hector
Home Financials for this Owner
Home Financials are based on the most recent Mortgage that was taken out on this home.
Original Mortgage
$206,755
Interest Rate
5.8%
Mortgage Type
FHA
Create a Home Valuation Report for This Property
The Home Valuation Report is an in-depth analysis detailing your home's value as well as a comparison with similar homes in the area
Home Values in the Area
Average Home Value in this Area
Purchase History
| Date | Buyer | Sale Price | Title Company |
|---|---|---|---|
| Landa Inocencio | -- | None Available | |
| Landa Inocencio | $131,500 | Chicago Title Company | |
| Landa Inocencio | -- | Chicago Title Company | |
| The Secretary Of Housing & Urban Develop | -- | None Available | |
| Bac Home Loans Servicing Lp | $222,675 | None Available | |
| Llanes Jose Hector | $210,000 | First American Title |
Source: Public Records
Mortgage History
| Date | Status | Borrower | Loan Amount |
|---|---|---|---|
| Previous Owner | Llanes Jose Hector | $206,755 |
Source: Public Records
Tax History Compared to Growth
Tax History
| Year | Tax Paid | Tax Assessment Tax Assessment Total Assessment is a certain percentage of the fair market value that is determined by local assessors to be the total taxable value of land and additions on the property. | Land | Improvement |
|---|---|---|---|---|
| 2025 | $2,049 | $168,461 | $38,430 | $130,031 |
| 2023 | $2,049 | $161,922 | $36,939 | $124,983 |
| 2022 | $1,984 | $158,748 | $36,215 | $122,533 |
| 2021 | $1,926 | $155,636 | $35,505 | $120,131 |
| 2020 | $1,855 | $154,041 | $35,141 | $118,900 |
| 2019 | $1,801 | $151,021 | $34,452 | $116,569 |
| 2018 | $1,785 | $148,061 | $33,777 | $114,284 |
| 2017 | $1,656 | $145,159 | $33,115 | $112,044 |
| 2016 | $1,580 | $142,314 | $32,466 | $109,848 |
| 2015 | $1,552 | $140,177 | $31,979 | $108,198 |
| 2014 | $1,436 | $130,150 | $30,000 | $100,150 |
Source: Public Records
Map
Nearby Homes
- 901 E Rivera Ave
- 900 Paseo de Alteza St
- 825 Andrade Ave
- 1268 Topaz Ct
- 1236 T Boman St
- 1252 Fiesta Ave
- 1149 Milpitas Dr
- 201 J A Rodney Ave
- 0 Avenida de Oro
- 711 N Preston Dr
- 920 E 4th St
- 1900 Rancho Frontera Ave Unit H59
- 2186 G Woo Ave
- 922 E 3rd St
- 722 Blair Ave
- 700 Blair Ave
- 952 Alameda St
- 2117 Descanso Dr
- 941 E 1st St
- 355 E 2nd St
- 1240 Sereno Dr
- 1232 Sereno Dr
- 1237 Mc Millin St
- 1233 Mc Millin St
- 1241 Mc Millin St
- 1244 Sereno Dr
- 1228 Sereno Dr
- 960 J Tapia Ct
- 961 A Monge Ct
- 1229 Mc Millin St
- 1245 Mc Millin St
- 1248 Sereno Dr
- 1224 Sereno Dr
- 964 J Tapia Ct
- 965 A Monge Ct
- 1225 Mc Millin St
- 1249 Mc Millin St
- 1240 Mc Millin St
- 1236 Mc Millin St
- 1244 Mc Millin St Unit 6