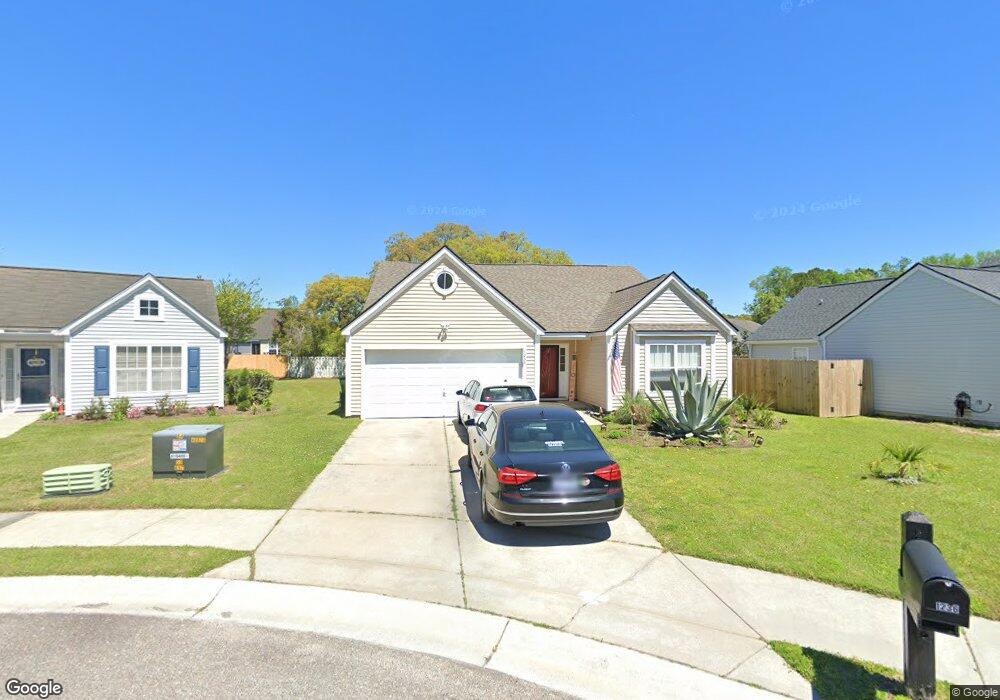
1236 Wando Shores Dr Charleston, SC 29492
Wando NeighborhoodEstimated Value: $440,000 - $505,000
3
Beds
2
Baths
1,459
Sq Ft
$332/Sq Ft
Est. Value
About This Home
This home is located at 1236 Wando Shores Dr, Charleston, SC 29492 and is currently estimated at $483,972, approximately $331 per square foot. 1236 Wando Shores Dr is a home located in Berkeley County.
Ownership History
Date
Name
Owned For
Owner Type
Purchase Details
Closed on
Sep 8, 2017
Sold by
Dawson Leigh
Bought by
Filan Melissa and Filan Sean Patrick
Current Estimated Value
Home Financials for this Owner
Home Financials are based on the most recent Mortgage that was taken out on this home.
Original Mortgage
$247,350
Outstanding Balance
$206,666
Interest Rate
3.92%
Mortgage Type
New Conventional
Estimated Equity
$277,306
Purchase Details
Closed on
Nov 7, 2011
Sold by
Deutsche Bank Trust Company Americas
Bought by
Dawson Leigh
Purchase Details
Closed on
May 18, 2011
Sold by
Dipaolo Michael A and Sery Michael P
Bought by
Deutsche Bank Trust Company Americas
Purchase Details
Closed on
Jan 28, 2005
Sold by
D R Horton Inc
Bought by
Dipaolo Michael A and Sery Michael P
Home Financials for this Owner
Home Financials are based on the most recent Mortgage that was taken out on this home.
Original Mortgage
$174,184
Interest Rate
6.25%
Mortgage Type
Adjustable Rate Mortgage/ARM
Create a Home Valuation Report for This Property
The Home Valuation Report is an in-depth analysis detailing your home's value as well as a comparison with similar homes in the area
Home Values in the Area
Average Home Value in this Area
Purchase History
| Date | Buyer | Sale Price | Title Company |
|---|---|---|---|
| Filan Melissa | $255,000 | None Available | |
| Dawson Leigh | $124,900 | -- | |
| Deutsche Bank Trust Company Americas | $85,000 | -- | |
| Dipaolo Michael A | $193,538 | -- |
Source: Public Records
Mortgage History
| Date | Status | Borrower | Loan Amount |
|---|---|---|---|
| Open | Filan Melissa | $247,350 | |
| Previous Owner | Dipaolo Michael A | $174,184 |
Source: Public Records
Tax History Compared to Growth
Tax History
| Year | Tax Paid | Tax Assessment Tax Assessment Total Assessment is a certain percentage of the fair market value that is determined by local assessors to be the total taxable value of land and additions on the property. | Land | Improvement |
|---|---|---|---|---|
| 2025 | $2,024 | $303,370 | $78,913 | $224,457 |
| 2024 | $2,024 | $12,135 | $3,157 | $8,978 |
| 2023 | $2,024 | $12,135 | $3,157 | $8,978 |
| 2022 | $1,858 | $10,552 | $3,000 | $7,552 |
| 2021 | $1,891 | $10,550 | $3,000 | $7,552 |
| 2020 | $1,928 | $10,552 | $3,000 | $7,552 |
| 2019 | $1,963 | $10,552 | $3,000 | $7,552 |
| 2018 | $1,893 | $10,152 | $2,600 | $7,552 |
| 2017 | $3,451 | $9,563 | $2,462 | $7,101 |
| 2016 | $3,474 | $9,560 | $2,460 | $7,100 |
| 2015 | $3,321 | $9,560 | $2,460 | $7,100 |
| 2014 | $3,159 | $9,560 | $2,460 | $7,100 |
| 2013 | -- | $9,560 | $2,460 | $7,100 |
Source: Public Records
Map
Nearby Homes
- 1436 Water Edge Dr
- 1344 Palm Cove Dr
- 213 Ashmont Dr
- 1295 Island Club Dr Unit C
- 1126 Peninsula Cove Dr
- 1316 Island Club Dr Unit A
- 1002 Marsh Grass Way Unit B
- 117 Wando Reach Rd
- 237 Nelliefield Creek Dr
- 308 Tidal Rice Ct
- 133 Wando Reach Rd
- 214 Rice Mill Place
- 142 Wando Reach Rd
- 141 Wando Reach Rd
- 1185 Rivers Reach Dr
- 1019 Jervey Point Rd
- 420 Nelliefield Trail
- 1157 Oak Bluff Ave
- 1161 Oak Bluff Ave
- 1165 Oak Bluff Ave
- 1232 Wando Shores Dr
- 1238 Wando Shores Dr
- 1228 Wando Shores Dr
- 1115 Ole Oak Dr
- 1119 Ole Oak Dr
- 1113 Ole Oak Dr
- 1240 Wando Shores Dr
- 1224 Wando Shores Dr
- 1121 Ole Oak Dr
- 1233 Wando Shores Dr
- 1239 Wando Shores Dr
- 1231 Wando Shores Dr
- 1235 Wando Shores Dr
- 1237 Wando Shores Dr
- 1222 Wando Shores Dr
- 1229 Wando Shores Dr
- 1123 Ole Oak Dr
- 1225 Wando Shores Dr
- 1218 Wando Shores Dr
- 1223 Wando Shores Dr