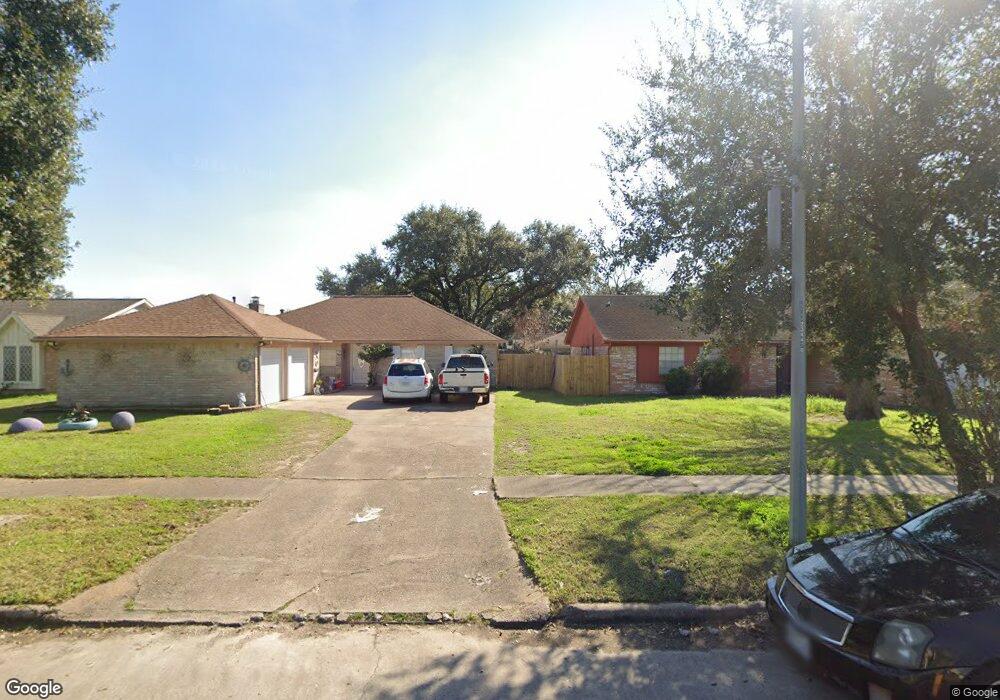
12361 S Dry Ashfrd St Unit 224 Houston, TX 77099
Alief NeighborhoodEstimated Value: $164,000 - $185,000
3
Beds
3
Baths
1,472
Sq Ft
$116/Sq Ft
Est. Value
About This Home
This home is located at 12361 S Dry Ashfrd St Unit 224, Houston, TX 77099 and is currently estimated at $170,756, approximately $116 per square foot. 12361 S Dry Ashfrd St Unit 224 is a home located in Harris County with nearby schools including Kennedy Elementary School, Holub Middle School, and Mata Intermediate School.
Ownership History
Date
Name
Owned For
Owner Type
Purchase Details
Closed on
Feb 27, 2004
Sold by
Mitchell Angela C
Bought by
Watson Al
Current Estimated Value
Home Financials for this Owner
Home Financials are based on the most recent Mortgage that was taken out on this home.
Original Mortgage
$74,690
Outstanding Balance
$34,858
Interest Rate
5.65%
Mortgage Type
Purchase Money Mortgage
Estimated Equity
$135,898
Purchase Details
Closed on
Jan 11, 2002
Sold by
Tran Dung V and Tran Chelsea D
Bought by
Mitchell Angela C
Home Financials for this Owner
Home Financials are based on the most recent Mortgage that was taken out on this home.
Original Mortgage
$59,330
Interest Rate
11.15%
Purchase Details
Closed on
Aug 25, 1998
Sold by
Morris Uselyn T
Bought by
Tran Dung V
Home Financials for this Owner
Home Financials are based on the most recent Mortgage that was taken out on this home.
Original Mortgage
$37,200
Interest Rate
6.94%
Create a Home Valuation Report for This Property
The Home Valuation Report is an in-depth analysis detailing your home's value as well as a comparison with similar homes in the area
Home Values in the Area
Average Home Value in this Area
Purchase History
| Date | Buyer | Sale Price | Title Company |
|---|---|---|---|
| Watson Al | -- | Alamo Title Company | |
| Mitchell Angela C | -- | Alamo Title Company | |
| Tran Dung V | -- | -- |
Source: Public Records
Mortgage History
| Date | Status | Borrower | Loan Amount |
|---|---|---|---|
| Open | Watson Al | $74,690 | |
| Previous Owner | Mitchell Angela C | $59,330 | |
| Previous Owner | Tran Dung V | $37,200 |
Source: Public Records
Tax History Compared to Growth
Tax History
| Year | Tax Paid | Tax Assessment Tax Assessment Total Assessment is a certain percentage of the fair market value that is determined by local assessors to be the total taxable value of land and additions on the property. | Land | Improvement |
|---|---|---|---|---|
| 2025 | -- | $149,033 | $27,375 | $121,658 |
| 2024 | -- | $160,538 | $27,375 | $133,163 |
| 2023 | $3,004 | $160,538 | $27,375 | $133,163 |
| 2022 | $2,978 | $131,544 | $27,375 | $104,169 |
| 2021 | $2,841 | $119,677 | $27,375 | $92,302 |
| 2020 | $2,676 | $109,982 | $27,375 | $82,607 |
| 2019 | $2,553 | $99,681 | $27,375 | $72,306 |
| 2018 | $146 | $93,463 | $27,375 | $66,088 |
| 2017 | $2,088 | $97,881 | $18,597 | $79,284 |
| 2016 | $1,898 | $82,816 | $15,735 | $67,081 |
| 2015 | $274 | $82,816 | $15,735 | $67,081 |
| 2014 | $274 | $59,725 | $11,348 | $48,377 |
Source: Public Records
Map
Nearby Homes
- 10325 Huntington Place Dr Unit 325
- 10327 Huntington Place Dr Unit 327
- 12419 Longbrook Dr
- 10362 Cook Rd Unit 187
- 10366 Panther Point Dr
- 10355 Panther Point Dr
- 10327 Panther Point Dr
- 12510 Panther Place Dr
- 10518 Huntington Dale Dr
- 12166 Huntington Venture Dr
- 10534 Huntington Wood Dr
- 12623 S Dairy Ashford Rd
- 12431 Huntington Field Dr
- 12122 Plumbrook Dr
- 12123 Plumpoint Dr
- 12346 Huntington Venture Dr
- 10602 Tenneta Dr
- 10530 Farmingham Dr
- 12310 Pine Knoll Dr
- 12211 Pine Knoll Dr
- 12361 S Dry Ashfrd St Unit 2361
- 12363 S Dry Ashfrd St Unit 2363
- 12359 S Dry Ashfrd St Unit 2359
- 12365 S Dry Ashfrd St Unit 2365
- 12357 S Dry Ashfrd St Unit 2357
- 12367 S Dairy Ashford Rd Unit 221
- 12355 S Dairy Ashford Rd Unit 227
- 12355 S Dairy Ashford Rd Unit 2355
- 12355 S Dry Ashfrd St Unit 2355
- 12367 S Dry Ashfrd St Unit 2367
- 12367 S Dry Ashfrd St Unit 221
- 10345 Huntington Place Dr Unit 345
- 10343 Huntington Place Dr Unit 343
- 12377 S Dry Ashfrd St Unit 2377
- 12375 S Dairy Ashford Rd Unit 234
- 12373 S Dry Ashfrd St Unit 2373
- 12373 S Dairy Ashford Rd Unit 235
- 12373 S Dry Ashfrd St Unit 235
- 12375 S Dry Ashfrd St Unit 2375
- 12377 S Dairy Ashford Rd Unit 2377