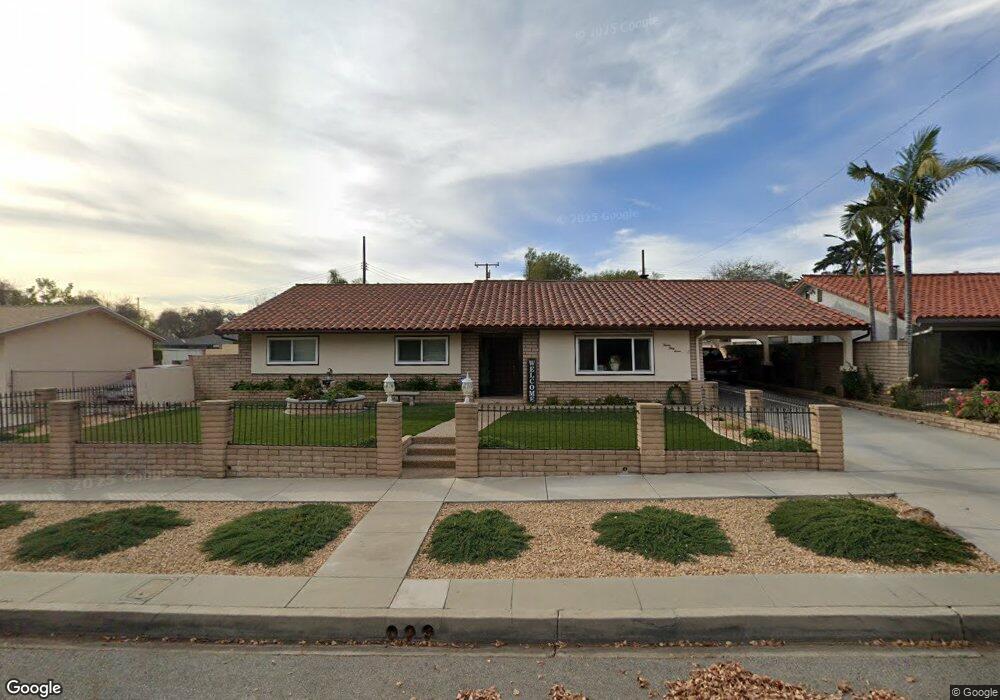
1237 N Shelley Ave Upland, CA 91786
Estimated Value: $908,000 - $1,120,000
6
Beds
3
Baths
2,708
Sq Ft
$366/Sq Ft
Est. Value
About This Home
This home is located at 1237 N Shelley Ave, Upland, CA 91786 and is currently estimated at $991,778, approximately $366 per square foot. 1237 N Shelley Ave is a home located in San Bernardino County with nearby schools including Sierra Vista Elementary School, Upland Junior High School, and Upland High School.
Ownership History
Date
Name
Owned For
Owner Type
Purchase Details
Closed on
Dec 2, 2020
Sold by
Delay Donald S and Delay Cathy A
Bought by
Delay Donald S and Delay Cathy A
Current Estimated Value
Home Financials for this Owner
Home Financials are based on the most recent Mortgage that was taken out on this home.
Original Mortgage
$303,000
Outstanding Balance
$220,408
Interest Rate
2.8%
Mortgage Type
New Conventional
Estimated Equity
$771,370
Purchase Details
Closed on
Oct 4, 2018
Sold by
Delay Donald S and Delay Cathy A
Bought by
Delay Donald S and Delay Cathy A
Purchase Details
Closed on
Oct 16, 2008
Sold by
Deutsche Bank National Trust Company
Bought by
Delay Don and Delay Cathy
Home Financials for this Owner
Home Financials are based on the most recent Mortgage that was taken out on this home.
Original Mortgage
$359,910
Interest Rate
5.9%
Mortgage Type
Purchase Money Mortgage
Purchase Details
Closed on
Jul 11, 2008
Sold by
Stallings Robin L
Bought by
Deutsche Bank National Trust Co and Soundview Home Loan Trust 2005-Opt4 Asse
Purchase Details
Closed on
Dec 30, 2005
Sold by
Stallings James
Bought by
Stallings Robin
Purchase Details
Closed on
Aug 31, 2005
Sold by
Stallings Robin
Bought by
Stallings James and Stallings Robin
Home Financials for this Owner
Home Financials are based on the most recent Mortgage that was taken out on this home.
Original Mortgage
$483,000
Interest Rate
5.35%
Mortgage Type
Purchase Money Mortgage
Purchase Details
Closed on
Aug 24, 2005
Sold by
Gant Tammy S
Bought by
Stallings Robin
Home Financials for this Owner
Home Financials are based on the most recent Mortgage that was taken out on this home.
Original Mortgage
$483,000
Interest Rate
5.35%
Mortgage Type
Purchase Money Mortgage
Purchase Details
Closed on
Apr 5, 2004
Sold by
Stallings James
Bought by
Gant Tammy S
Home Financials for this Owner
Home Financials are based on the most recent Mortgage that was taken out on this home.
Original Mortgage
$400,000
Interest Rate
5.3%
Mortgage Type
Purchase Money Mortgage
Purchase Details
Closed on
Aug 21, 2000
Sold by
Volm Robert L
Bought by
Stallings James and Stallings Robin
Home Financials for this Owner
Home Financials are based on the most recent Mortgage that was taken out on this home.
Original Mortgage
$237,900
Interest Rate
8.13%
Create a Home Valuation Report for This Property
The Home Valuation Report is an in-depth analysis detailing your home's value as well as a comparison with similar homes in the area
Home Values in the Area
Average Home Value in this Area
Purchase History
| Date | Buyer | Sale Price | Title Company |
|---|---|---|---|
| Delay Donald S | -- | Wfg National Title Company | |
| Delay Donald S | -- | Wfg National Title Company | |
| Delay Donald S | -- | None Available | |
| Delay Don | $400,000 | First American Title Ins Co | |
| Deutsche Bank National Trust Co | $478,550 | Fidelity National Title Co | |
| Stallings Robin | -- | -- | |
| Stallings James | -- | United Title | |
| Stallings Robin | -- | -- | |
| Stallings Robin | -- | -- | |
| Gant Tammy S | $500,000 | United Title Orange | |
| Stallings James | $245,000 | First American Title Ins Co |
Source: Public Records
Mortgage History
| Date | Status | Borrower | Loan Amount |
|---|---|---|---|
| Open | Delay Donald S | $303,000 | |
| Closed | Delay Don | $359,910 | |
| Previous Owner | Stallings Robin | $483,000 | |
| Previous Owner | Stallings Robin | $483,000 | |
| Previous Owner | Gant Tammy S | $400,000 | |
| Previous Owner | Stallings James | $237,900 | |
| Closed | Gant Tammy S | $100,000 |
Source: Public Records
Tax History
| Year | Tax Paid | Tax Assessment Tax Assessment Total Assessment is a certain percentage of the fair market value that is determined by local assessors to be the total taxable value of land and additions on the property. | Land | Improvement |
|---|---|---|---|---|
| 2025 | $5,659 | $515,106 | $180,288 | $334,818 |
| 2024 | $5,478 | $505,006 | $176,753 | $328,253 |
| 2023 | $5,394 | $495,104 | $173,287 | $321,817 |
| 2022 | $5,277 | $485,396 | $169,889 | $315,507 |
| 2021 | $5,269 | $475,879 | $166,558 | $309,321 |
| 2020 | $5,126 | $470,999 | $164,850 | $306,149 |
| 2019 | $5,107 | $461,764 | $161,618 | $300,146 |
| 2018 | $4,981 | $452,710 | $158,449 | $294,261 |
| 2017 | $4,837 | $443,833 | $155,342 | $288,491 |
| 2016 | $4,619 | $435,130 | $152,296 | $282,834 |
| 2015 | $4,513 | $428,594 | $150,008 | $278,586 |
| 2014 | $4,396 | $420,199 | $147,070 | $273,129 |
Source: Public Records
Map
Nearby Homes
- 1270 N Euclid Ave
- 1234 N Laurel Ave
- 1318 N Laurel Ave
- 171 E 14th St
- 922 N 4th Ave
- 1418 Winston Ct
- 769 Valadez St
- 855 N Palm Ave
- 910 N Redding Way Unit I
- 910 N Redding Way Unit F
- 655 Doreen Ct
- 929 E Foothill Blvd Unit 91
- 929 E Foothill Blvd Unit 15
- 929 E Foothill Blvd Unit 46
- 929 E Foothill Blvd Unit 161
- 929 E Foothill Blvd
- 929 E Foothill Blvd Unit 53
- 1403 N Tulare Way
- 636 N Palm Ave
- 509 N Euclid Ave
- 1255 N Shelley Ave
- 271 E Nisbet Dr
- 247 E Nisbet Dr
- 1277 N Shelley Ave
- 229 E Nisbet Dr
- 1236 N Shelley Ave
- 1256 N Shelley Ave
- 1220 N Shelley Ave
- 1291 N Shelley Ave
- 215 E Nisbet Dr
- 1272 N Shelley Ave
- 1202 N Shelley Ave
- 266 E Nisbet Dr
- 248 E Nisbet Dr
- 1292 N Shelley Ave
- 193 E Nisbet Dr
- 286 E Nisbet Dr
- 230 E Nisbet Dr
- 200 E 13th St
- 294 E Nisbet Dr
Your Personal Tour Guide
Ask me questions while you tour the home.