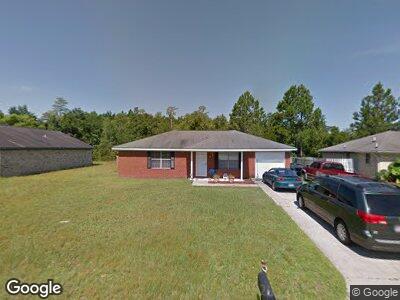
1237 Pineridge Way Hinesville, GA 31313
Estimated Value: $203,000 - $222,000
3
Beds
2
Baths
1,092
Sq Ft
$193/Sq Ft
Est. Value
About This Home
This home is located at 1237 Pineridge Way, Hinesville, GA 31313 and is currently estimated at $211,048, approximately $193 per square foot. 1237 Pineridge Way is a home located in Liberty County with nearby schools including Taylors Creek Elementary School, Lewis Frasier Middle School, and Bradwell Institute.
Ownership History
Date
Name
Owned For
Owner Type
Purchase Details
Closed on
Mar 9, 2007
Sold by
Lloyd Anthony
Bought by
Humphrey David W
Current Estimated Value
Home Financials for this Owner
Home Financials are based on the most recent Mortgage that was taken out on this home.
Original Mortgage
$105,700
Interest Rate
6.22%
Mortgage Type
FHA
Purchase Details
Closed on
Sep 28, 2000
Sold by
Lloyd Anthony
Bought by
Secretary Of Veterans Affairs
Purchase Details
Closed on
Mar 7, 2000
Sold by
Countrywide Home Loa
Bought by
Sec Of V A
Purchase Details
Closed on
Feb 28, 1996
Sold by
Clay Sikes Construction
Bought by
Floyd James L
Purchase Details
Closed on
Sep 14, 1995
Sold by
Sikes Clay and Sikes
Bought by
Clay Sikes Development
Purchase Details
Closed on
Nov 15, 1991
Bought by
Sikes Clay and Sikes
Create a Home Valuation Report for This Property
The Home Valuation Report is an in-depth analysis detailing your home's value as well as a comparison with similar homes in the area
Home Values in the Area
Average Home Value in this Area
Purchase History
| Date | Buyer | Sale Price | Title Company |
|---|---|---|---|
| Humphrey David W | $103,500 | -- | |
| Secretary Of Veterans Affairs | -- | -- | |
| Sec Of V A | -- | -- | |
| Countrywide Home Loa | $56,000 | -- | |
| Floyd James L | $65,000 | -- | |
| Clay Sikes Development | -- | -- | |
| Clay Sikes Construction | -- | -- | |
| Sikes Clay | -- | -- |
Source: Public Records
Mortgage History
| Date | Status | Borrower | Loan Amount |
|---|---|---|---|
| Open | Humphrey David W | $108,800 | |
| Closed | Humphrey David W | $105,700 |
Source: Public Records
Tax History Compared to Growth
Tax History
| Year | Tax Paid | Tax Assessment Tax Assessment Total Assessment is a certain percentage of the fair market value that is determined by local assessors to be the total taxable value of land and additions on the property. | Land | Improvement |
|---|---|---|---|---|
| 2024 | $2,858 | $58,082 | $7,200 | $50,882 |
| 2023 | $2,858 | $52,198 | $7,200 | $44,998 |
| 2022 | $2,033 | $43,525 | $7,200 | $36,325 |
| 2021 | $1,777 | $37,304 | $7,200 | $30,104 |
| 2020 | $1,623 | $33,719 | $6,000 | $27,719 |
| 2019 | $1,561 | $32,666 | $6,000 | $26,666 |
| 2018 | $1,568 | $32,998 | $6,000 | $26,998 |
| 2017 | $1,098 | $33,329 | $6,000 | $27,329 |
| 2016 | $1,524 | $33,660 | $6,000 | $27,660 |
| 2015 | $1,748 | $33,660 | $6,000 | $27,660 |
| 2014 | $1,748 | $38,257 | $9,200 | $29,057 |
| 2013 | -- | $37,974 | $8,000 | $29,974 |
Source: Public Records
Map
Nearby Homes
- 1237 Pineridge Way
- 1235 Pineridge Way
- 1239 Pineridge Way
- 1233 Pineridge Way
- 1241 Pineridge Way
- 1240 Pineridge Way
- 1234 Pineridge Way
- 1231 Pineridge Way
- 1242 Pineridge Way
- 1234 Loblolly Dr
- 1305 Loblolly Dr
- 1302 Loblolly Dr Unit n/a
- 1302 Loblolly Dr
- 1267 Windrow Dr
- 1265 Windrow Dr
- 1229 Pineridge Way
- 1269 Windrow Dr
- 1252 Evergreen Trail
- 1266 Evergreen Trail
- 1304 Loblolly Dr