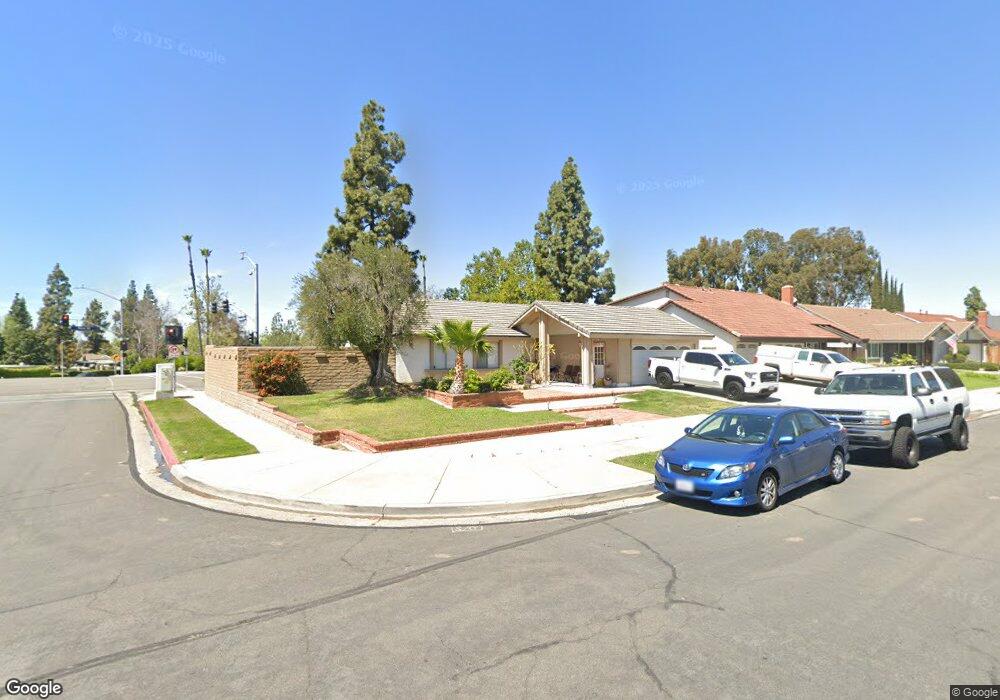
1237 Valparaiso Dr N Placentia, CA 92870
Estimated Value: $985,730 - $1,165,000
3
Beds
2
Baths
1,470
Sq Ft
$732/Sq Ft
Est. Value
About This Home
This home is located at 1237 Valparaiso Dr N, Placentia, CA 92870 and is currently estimated at $1,076,183, approximately $732 per square foot. 1237 Valparaiso Dr N is a home located in Orange County with nearby schools including Van Buren Elementary School, Kraemer Middle School, and Valencia High School.
Ownership History
Date
Name
Owned For
Owner Type
Purchase Details
Closed on
Jan 27, 2015
Sold by
Razi Shahrokh and Razi Iris
Bought by
Yachad Llc
Current Estimated Value
Purchase Details
Closed on
Jan 14, 2008
Sold by
Abtahi Khosrow
Bought by
Razi Shahrokh
Purchase Details
Closed on
Sep 15, 2003
Sold by
Razi Shahrokh
Bought by
Razi Shahrokh and Abtahi Khosrow
Purchase Details
Closed on
Aug 15, 2003
Sold by
Abtahi Khosrow
Bought by
Razi Shahrokh
Purchase Details
Closed on
Jul 16, 2003
Sold by
Razi Iris
Bought by
Razi Shahrokh
Purchase Details
Closed on
Nov 19, 2002
Sold by
Simon Emmett F
Bought by
Abtahi Khosrow and Razi Shahrokh
Purchase Details
Closed on
Jun 7, 1999
Sold by
Pike Harold
Bought by
Simon Emmett F
Purchase Details
Closed on
Aug 8, 1995
Sold by
Simon Fawnetta M
Bought by
Pike Harold
Create a Home Valuation Report for This Property
The Home Valuation Report is an in-depth analysis detailing your home's value as well as a comparison with similar homes in the area
Home Values in the Area
Average Home Value in this Area
Purchase History
| Date | Buyer | Sale Price | Title Company |
|---|---|---|---|
| Yachad Llc | -- | None Available | |
| Razi Shahrokh | -- | None Available | |
| Razi Shahrokh | -- | None Available | |
| Razi Shahrokh | -- | -- | |
| Razi Shahrokh | -- | Chicago Title Co | |
| Razi Shahrokh | -- | Chicago Title Co | |
| Abtahi Khosrow | $7,000 | -- | |
| Abtahi Khosrow | -- | -- | |
| Simon Emmett F | -- | -- | |
| Pike Harold | -- | -- |
Source: Public Records
Tax History
| Year | Tax Paid | Tax Assessment Tax Assessment Total Assessment is a certain percentage of the fair market value that is determined by local assessors to be the total taxable value of land and additions on the property. | Land | Improvement |
|---|---|---|---|---|
| 2025 | $5,641 | $444,059 | $325,252 | $118,807 |
| 2024 | $5,641 | $435,352 | $318,874 | $116,478 |
| 2023 | $5,505 | $426,816 | $312,621 | $114,195 |
| 2022 | $5,402 | $418,448 | $306,492 | $111,956 |
| 2021 | $5,256 | $410,244 | $300,483 | $109,761 |
| 2020 | $5,157 | $406,038 | $297,402 | $108,636 |
| 2019 | $4,949 | $398,077 | $291,571 | $106,506 |
| 2018 | $4,884 | $390,272 | $285,854 | $104,418 |
| 2017 | $4,801 | $382,620 | $280,249 | $102,371 |
| 2016 | $4,706 | $375,118 | $274,754 | $100,364 |
| 2015 | $4,644 | $369,484 | $270,627 | $98,857 |
| 2014 | $4,515 | $362,247 | $265,326 | $96,921 |
Source: Public Records
Map
Nearby Homes
- 1232 Woodside Dr
- 1261 Brian St
- 1355 Montevideo Ave
- 1000 Henrietta Cir
- 5142 Hamer Ln
- 1509 Prospect Ave Unit D
- 1280 Dominica Cir
- 1248 Carlsbad St
- 1232 E Providence Loop
- 642 Patten Ave
- 1234 Verona Place
- 635 Patten Ave
- 617 Patten Ave
- 1330 Limerick Dr
- 611 Patten Ave
- 607 Patten Ave
- 605 Patten Ave
- 1126 Naples Ave
- 603 Patten Ave
- 581 Patten Ave
- 1241 Valparaiso Dr N
- 1245 Valparaiso Dr N
- 1233 Valparaiso Dr N
- 1238 Valparaiso Dr N
- 1242 Valparaiso Dr N
- 1230 Valparaiso Dr N
- 1249 Valparaiso Dr N
- 1246 Valparaiso Dr E
- 1229 Valparaiso Dr N
- 1226 Valparaiso Dr N
- 1201 N Rose Dr Unit 201
- 1241 Salvador Dr E
- 1239 Salvador Dr
- 1225 Valparaiso Dr N
- 1237 Salvador Dr
- 1250 Valparaiso Dr E
- 1243 Salvador Dr E
- 1251 Valparaiso Dr E
- 1222 Valparaiso Dr N
- 1231 Salvador Dr
Your Personal Tour Guide
Ask me questions while you tour the home.