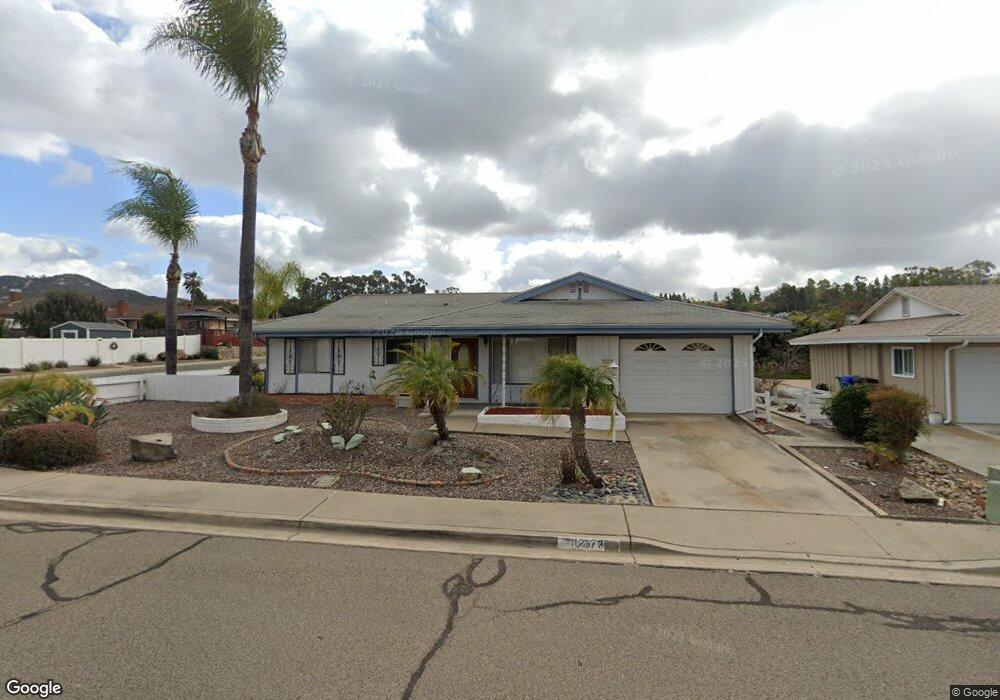
12373 Mantilla Rd San Diego, CA 92128
Rancho Bernardo NeighborhoodEstimated Value: $665,000 - $802,000
2
Beds
1
Bath
1,000
Sq Ft
$735/Sq Ft
Est. Value
About This Home
This home is located at 12373 Mantilla Rd, San Diego, CA 92128 and is currently estimated at $735,176, approximately $735 per square foot. 12373 Mantilla Rd is a home located in San Diego County with nearby schools including Highland Ranch Elementary School, Bernardo Heights Middle, and Rancho Bernardo High.
Ownership History
Date
Name
Owned For
Owner Type
Purchase Details
Closed on
Nov 7, 2006
Sold by
Young F Thomas and Young Coralina R
Bought by
Young F Thomas and Young Coralina R
Current Estimated Value
Purchase Details
Closed on
Sep 16, 1999
Sold by
Noonan Matthew C and Noonan Patricia A
Bought by
Young F Thomas and Young Coralina R
Purchase Details
Closed on
Aug 9, 1997
Sold by
Noonan Patricia A
Bought by
Noonan Matthew C and Noonan Patricia A
Home Financials for this Owner
Home Financials are based on the most recent Mortgage that was taken out on this home.
Original Mortgage
$35,000
Interest Rate
7.61%
Purchase Details
Closed on
Apr 18, 1994
Sold by
Noonan Matthew C
Bought by
Noonan Patricia A
Purchase Details
Closed on
Aug 6, 1993
Sold by
Noonan Matthew C and Noonan Patricia A
Bought by
Noonan Matthew Christopher and Noonan Patricia Anne
Purchase Details
Closed on
Mar 22, 1991
Create a Home Valuation Report for This Property
The Home Valuation Report is an in-depth analysis detailing your home's value as well as a comparison with similar homes in the area
Home Values in the Area
Average Home Value in this Area
Purchase History
| Date | Buyer | Sale Price | Title Company |
|---|---|---|---|
| Young F Thomas | -- | None Available | |
| Young F Thomas | $174,000 | Old Republic Title Company | |
| Noonan Matthew C | -- | Gateway Title Company | |
| Noonan Patricia A | -- | -- | |
| Noonan Matthew Christopher | -- | -- | |
| -- | $119,000 | -- |
Source: Public Records
Mortgage History
| Date | Status | Borrower | Loan Amount |
|---|---|---|---|
| Previous Owner | Noonan Matthew C | $35,000 |
Source: Public Records
Tax History Compared to Growth
Tax History
| Year | Tax Paid | Tax Assessment Tax Assessment Total Assessment is a certain percentage of the fair market value that is determined by local assessors to be the total taxable value of land and additions on the property. | Land | Improvement |
|---|---|---|---|---|
| 2025 | $3,008 | $267,406 | $128,087 | $139,319 |
| 2024 | $3,008 | $262,164 | $125,576 | $136,588 |
| 2023 | $2,944 | $257,024 | $123,114 | $133,910 |
| 2022 | $2,895 | $251,985 | $120,700 | $131,285 |
| 2021 | $2,858 | $247,045 | $118,334 | $128,711 |
| 2020 | $2,820 | $244,513 | $117,121 | $127,392 |
| 2019 | $2,748 | $239,720 | $114,825 | $124,895 |
| 2018 | $2,671 | $235,021 | $112,574 | $122,447 |
| 2017 | $2,600 | $230,414 | $110,367 | $120,047 |
| 2016 | $2,547 | $225,897 | $108,203 | $117,694 |
| 2015 | $2,509 | $222,505 | $106,578 | $115,927 |
| 2014 | $2,452 | $218,148 | $104,491 | $113,657 |
Source: Public Records
Map
Nearby Homes
- 12494 Senda Rd
- 12365 Horado Rd
- 12486 Lomica Dr
- 16422 Roca Dr
- 16413 Roca Dr
- 16515 Felice Dr
- 16498 Roca Dr
- 12249 Horado Rd
- 16182 Selva Dr
- 16421 Ramada Dr
- 12257 Avenida Consentido
- 12424 Rios Rd
- 16632 Roca Dr Unit 41
- 16556 Gabarda Rd
- 12195 San Tomas Place
- 16660 Roca Dr
- 16407 Caminito Vecinos Unit 155
- 12753 Caminito Cancion Unit 129
- 12821 Avenida la Valencia
- 15945 Avenida Villaha Unit 32
- 12363 Mantilla Rd
- 12374 Lomica Dr
- 12364 Lomica Dr
- 12411 Mantilla Rd
- 12353 Mantilla Rd
- 12402 Lomica Dr
- 12354 Lomica Dr
- 12360 Mantilla Rd
- 12402 Mantilla Rd
- 12421 Mantilla Rd
- 12343 Mantilla Rd
- 12412 Mantilla Rd
- 12350 Mantilla Rd
- 12416 Lomica Dr
- 12344 Lomica Dr
- 12422 Mantilla Rd
- 12431 Mantilla Rd
- 12377 Lomica Dr
- 12449 Senda Rd
- 12435 Senda Rd