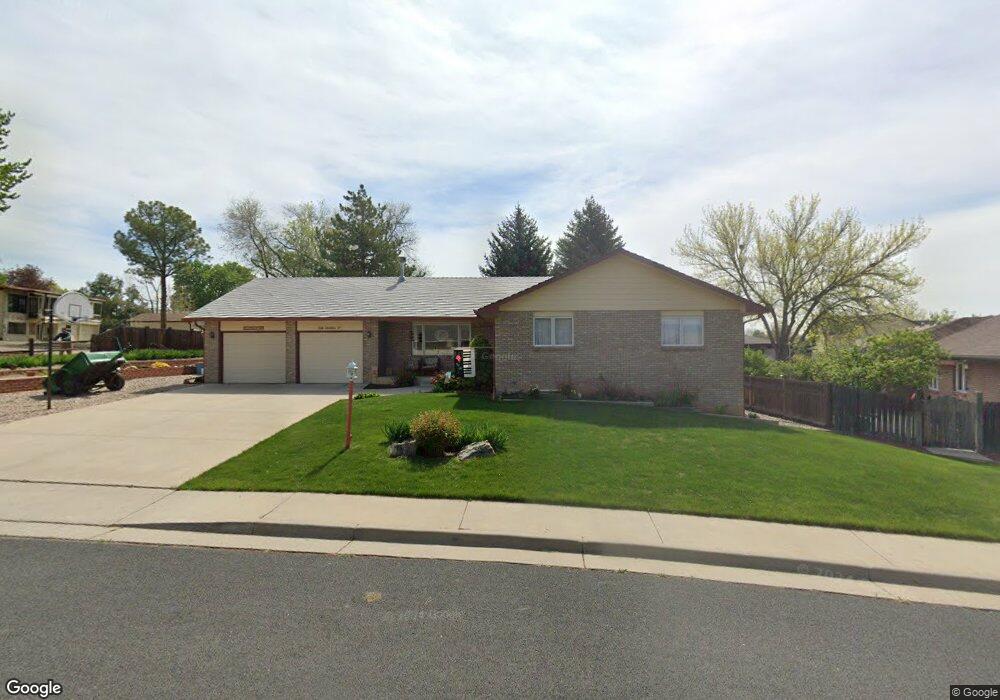
1238 Amanda Ct Loveland, CO 80537
Estimated Value: $555,337 - $695,000
3
Beds
3
Baths
1,859
Sq Ft
$341/Sq Ft
Est. Value
About This Home
This home is located at 1238 Amanda Ct, Loveland, CO 80537 and is currently estimated at $633,834, approximately $340 per square foot. 1238 Amanda Ct is a home located in Larimer County with nearby schools including Namaqua Elementary School, Walt Clark Middle School, and Thompson Valley High School.
Ownership History
Date
Name
Owned For
Owner Type
Purchase Details
Closed on
Feb 18, 2000
Sold by
Raveling Lynn Richard Judith Anne
Bought by
Eastman Mike Frank and Eastman Elaine Marie
Current Estimated Value
Home Financials for this Owner
Home Financials are based on the most recent Mortgage that was taken out on this home.
Original Mortgage
$117,000
Interest Rate
8.19%
Purchase Details
Closed on
Oct 22, 1996
Sold by
Raveling Lynn Richard
Bought by
Raveling Lynn Richard and Raveling Judith Anne
Purchase Details
Closed on
Mar 1, 1996
Sold by
Raveling Linda Lee
Bought by
Raveling Lynn Richard
Purchase Details
Closed on
Sep 1, 1994
Sold by
Spencer Robert J
Bought by
Raveling Linda Lee
Purchase Details
Closed on
Feb 1, 1994
Sold by
Morgan Tracy D
Bought by
Spencer Robert J
Purchase Details
Closed on
Dec 1, 1992
Sold by
Morgan Thelma L
Bought by
Morgan Tracy D
Create a Home Valuation Report for This Property
The Home Valuation Report is an in-depth analysis detailing your home's value as well as a comparison with similar homes in the area
Home Values in the Area
Average Home Value in this Area
Purchase History
| Date | Buyer | Sale Price | Title Company |
|---|---|---|---|
| Eastman Mike Frank | $232,000 | -- | |
| Raveling Lynn Richard | -- | -- | |
| Raveling Lynn Richard | -- | -- | |
| Raveling Linda Lee | $165,000 | -- | |
| Spencer Robert J | $32,000 | -- | |
| Morgan Tracy D | -- | -- |
Source: Public Records
Mortgage History
| Date | Status | Borrower | Loan Amount |
|---|---|---|---|
| Closed | Eastman Mike Frank | $117,000 |
Source: Public Records
Tax History Compared to Growth
Tax History
| Year | Tax Paid | Tax Assessment Tax Assessment Total Assessment is a certain percentage of the fair market value that is determined by local assessors to be the total taxable value of land and additions on the property. | Land | Improvement |
|---|---|---|---|---|
| 2025 | $2,422 | $40,736 | $4,690 | $36,046 |
| 2024 | $2,336 | $40,736 | $4,690 | $36,046 |
| 2022 | $1,929 | $31,199 | $4,865 | $26,334 |
| 2021 | $1,983 | $32,096 | $5,005 | $27,091 |
| 2020 | $1,710 | $28,657 | $5,005 | $23,652 |
| 2019 | $1,681 | $28,657 | $5,005 | $23,652 |
| 2018 | $1,385 | $24,026 | $5,040 | $18,986 |
| 2017 | $1,193 | $24,026 | $5,040 | $18,986 |
| 2016 | $947 | $20,871 | $5,572 | $15,299 |
| 2015 | $939 | $20,870 | $5,570 | $15,300 |
| 2014 | $806 | $18,680 | $4,220 | $14,460 |
Source: Public Records
Map
Nearby Homes
- 1304 Pine St
- 1682 Stove Prairie Cir
- 1670 Stove Prairie Cir
- 1726 Kennedy Ave
- 2387 W U S 34
- 1131 W Broadmoor Dr
- 1125 W Broadmoor Dr
- 1942 Lakewood Dr
- 1209 E Broadmoor Dr
- 1506 N Empire Ave
- 2002 Falls Ct
- 2467 Farisita Dr
- 2030 W 17th St Unit A8
- 2217 Durango Dr
- 2216 Durango Dr
- 3625 Como Ct
- 1633 Van Buren Ave Unit 1
- 2264 Durango Dr
- 2370 Fleming Dr
- 3363 Cuchara Ct
- 2879 Zachary Dr
- 2774 Imperial Ridge Dr
- 1213 Walnut St
- 1221 Amanda Ct
- 2762 Imperial Ridge Dr
- 2855 Zachary Dr
- 1212 Walnut St
- 1209 Pine St
- 2915 Zachary Dr
- 2886 Zachary Dr
- 1225 Gateway Dr
- 2872 Zachary Dr
- 2775 Imperial Ridge Dr
- 2902 Zachary Dr
- 1213 Pine St
- 1300 Walnut St
- 2854 Zachary Dr
- 1300 Pine St
- 1346 Pine St
- 2763 Imperial Ridge Dr