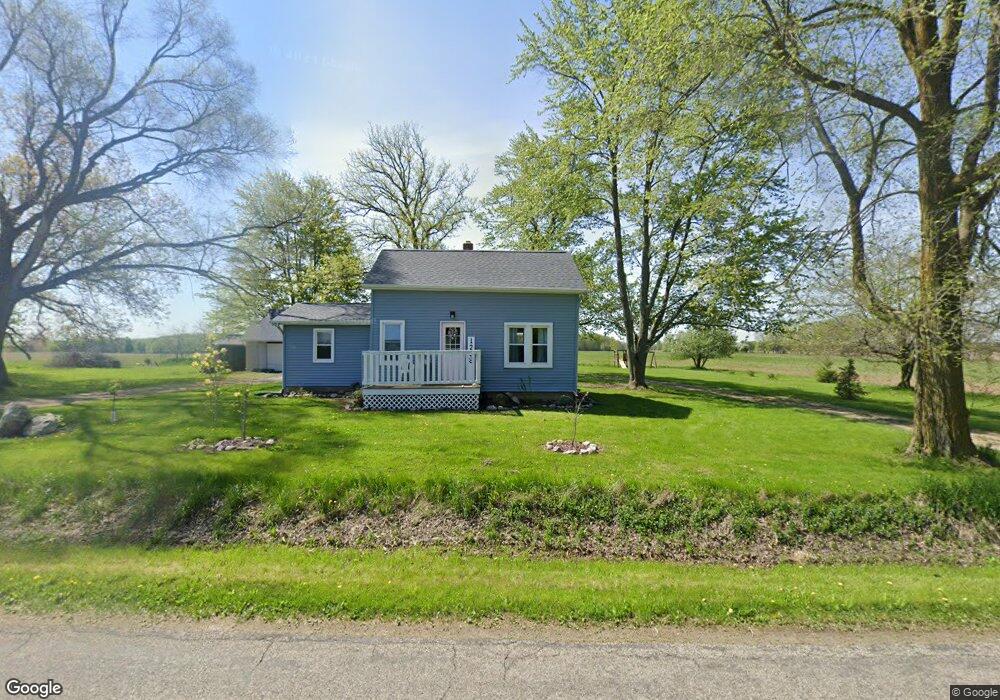
1238 E Columbia Rd Dansville, MI 48819
Estimated Value: $173,000 - $267,000
2
Beds
1
Bath
876
Sq Ft
$229/Sq Ft
Est. Value
About This Home
This home is located at 1238 E Columbia Rd, Dansville, MI 48819 and is currently estimated at $200,566, approximately $228 per square foot. 1238 E Columbia Rd is a home located in Ingham County with nearby schools including Dansville Elementary School, Dansville Middle School, and Dansville High School.
Ownership History
Date
Name
Owned For
Owner Type
Purchase Details
Closed on
Oct 19, 2017
Sold by
Ferreira Tracy D
Bought by
Deweerd Karen L
Current Estimated Value
Home Financials for this Owner
Home Financials are based on the most recent Mortgage that was taken out on this home.
Original Mortgage
$55,000
Outstanding Balance
$45,953
Interest Rate
3.83%
Mortgage Type
New Conventional
Estimated Equity
$154,613
Purchase Details
Closed on
Oct 15, 2010
Sold by
Schroeder Kenneth and Schroeder Collette
Bought by
Ferreira Tracy D
Home Financials for this Owner
Home Financials are based on the most recent Mortgage that was taken out on this home.
Original Mortgage
$74,744
Interest Rate
4.75%
Mortgage Type
FHA
Purchase Details
Closed on
Aug 16, 2007
Sold by
Nevills Penny S
Bought by
Wachovia Bank Na
Create a Home Valuation Report for This Property
The Home Valuation Report is an in-depth analysis detailing your home's value as well as a comparison with similar homes in the area
Home Values in the Area
Average Home Value in this Area
Purchase History
| Date | Buyer | Sale Price | Title Company |
|---|---|---|---|
| Deweerd Karen L | $100,000 | Transnation Title Agency | |
| Ferreira Tracy D | $86,000 | Transnation | |
| Wachovia Bank Na | $46,799 | None Available |
Source: Public Records
Mortgage History
| Date | Status | Borrower | Loan Amount |
|---|---|---|---|
| Open | Deweerd Karen L | $55,000 | |
| Previous Owner | Ferreira Tracy D | $74,744 |
Source: Public Records
Tax History Compared to Growth
Tax History
| Year | Tax Paid | Tax Assessment Tax Assessment Total Assessment is a certain percentage of the fair market value that is determined by local assessors to be the total taxable value of land and additions on the property. | Land | Improvement |
|---|---|---|---|---|
| 2025 | $1,980 | $78,300 | $12,900 | $65,400 |
| 2024 | $1,843 | $75,200 | $12,500 | $62,700 |
| 2023 | $1,843 | $69,600 | $13,200 | $56,400 |
| 2022 | $1,770 | $44,700 | $13,800 | $30,900 |
| 2021 | $1,762 | $43,800 | $12,500 | $31,300 |
| 2020 | $1,646 | $44,900 | $19,400 | $25,500 |
| 2019 | $1,588 | $40,100 | $16,800 | $23,300 |
| 2018 | $1,576 | $37,500 | $14,200 | $23,300 |
| 2017 | $1,460 | $35,167 | $13,500 | $21,667 |
| 2016 | $1,408 | $37,690 | $13,000 | $24,690 |
| 2015 | -- | $34,722 | $26,000 | $8,722 |
| 2014 | -- | $35,047 | $26,500 | $8,547 |
Source: Public Records
Map
Nearby Homes
- VL N Williamston Rd
- 354 S Clark Rd
- 905 Union St
- 1118 S Jackson St
- 595 W Howell Rd
- 0 W Dansville Rd
- Lot 4 E Dexter Trail
- Lot 3 E Dexter Trail
- 1474 E Dexter Trail Unit Dansville MI 48819
- 1474 E Dexter Trail
- Lot 7 Sunset Ave
- Lot 5 Sunset Ave
- Lot 6 Sunset Ave
- Lot 8 7 Gables Rd
- 620 S Every Rd
- 2280 Swan Rd
- 2061 N Williamston Rd
- 2260 Holt Rd
- 1286 W Dansville Rd
- 1940 Meech Rd
- 1239 E Columbia Rd
- 1301 E Columbia Rd
- 1322 E Columbia Rd
- 1414 E Columbia Rd
- 729 S Williamston Rd
- 45 N Williamston Rd
- 0 S Clark Rd
- 133 S Clark Rd
- 8 S Clark Rd
- 12 S Williamston Rd
- 26 S Williamston Rd
- 42 S Williamston Rd
- 132 N Clark Rd
- 78 S Williamston Rd
- 35 S Williamston Rd
- 193 S Clark Rd
- 158 N Clark Rd
- 150 N Clark Rd
- 273 S Clark Rd
- 1530 E Columbia Rd