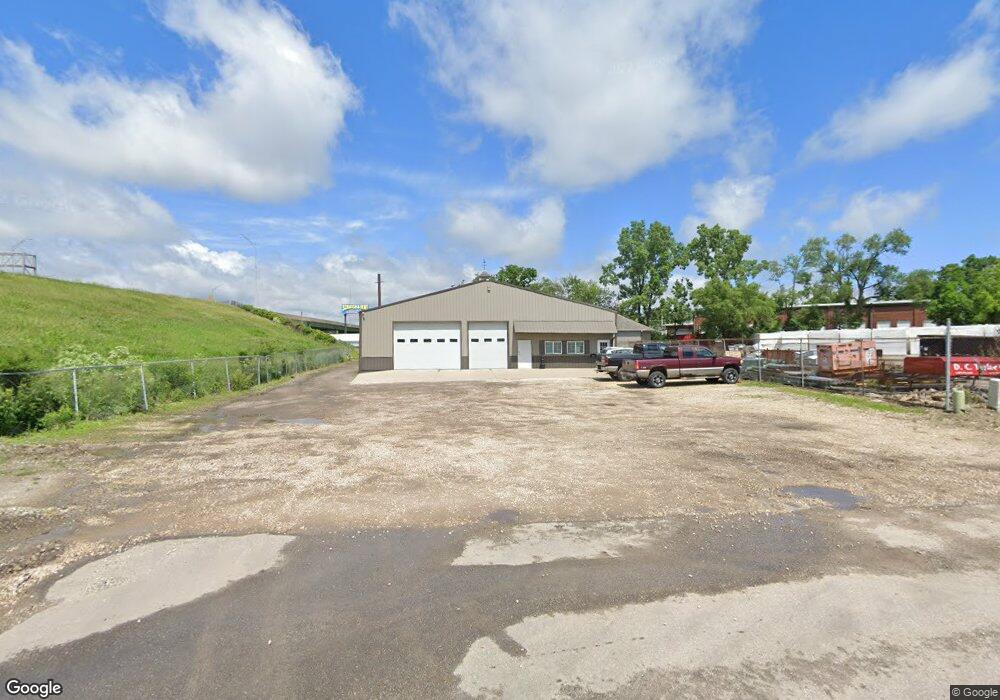
1238 Lake Ave NE Cedar Rapids, IA 52402
--
Bed
--
Bath
5,148
Sq Ft
0.36
Acres
About This Home
This home is located at 1238 Lake Ave NE, Cedar Rapids, IA 52402. 1238 Lake Ave NE is a home located in Linn County with nearby schools including Garfield Elementary School, Franklin Middle School, and George Washington High School.
Ownership History
Date
Name
Owned For
Owner Type
Purchase Details
Closed on
Mar 4, 2021
Sold by
Bridgehaven Pregnancy Support Center
Bought by
Brajul Investments Inc
Purchase Details
Closed on
Sep 5, 2013
Sold by
Robison Brad and Robison Bradley D
Bought by
Brajul Investments Inc
Home Financials for this Owner
Home Financials are based on the most recent Mortgage that was taken out on this home.
Original Mortgage
$224,000
Interest Rate
4.29%
Mortgage Type
Commercial
Purchase Details
Closed on
Apr 26, 2011
Sold by
Turkal Scott A and Turkal Cindy J
Bought by
Robinson Brad
Home Financials for this Owner
Home Financials are based on the most recent Mortgage that was taken out on this home.
Original Mortgage
$130,000
Interest Rate
8%
Mortgage Type
Seller Take Back
Purchase Details
Closed on
Jul 5, 2002
Sold by
David Folkadahl Linda A and David Folkadahl
Bought by
A & H Properties Llc
Home Financials for this Owner
Home Financials are based on the most recent Mortgage that was taken out on this home.
Original Mortgage
$100,660
Interest Rate
6.56%
Create a Home Valuation Report for This Property
The Home Valuation Report is an in-depth analysis detailing your home's value as well as a comparison with similar homes in the area
Home Values in the Area
Average Home Value in this Area
Purchase History
| Date | Buyer | Sale Price | Title Company |
|---|---|---|---|
| Brajul Investments Inc | $335,000 | None Available | |
| Brajul Investments Inc | -- | None Available | |
| Robinson Brad | $140,000 | None Available | |
| A & H Properties Llc | $22,000 | -- |
Source: Public Records
Mortgage History
| Date | Status | Borrower | Loan Amount |
|---|---|---|---|
| Previous Owner | Brajul Investments Inc | $224,000 | |
| Previous Owner | Robinson Brad | $130,000 | |
| Previous Owner | A & H Properties Llc | $100,660 |
Source: Public Records
Tax History Compared to Growth
Tax History
| Year | Tax Paid | Tax Assessment Tax Assessment Total Assessment is a certain percentage of the fair market value that is determined by local assessors to be the total taxable value of land and additions on the property. | Land | Improvement |
|---|---|---|---|---|
| 2025 | $2,806 | $169,100 | $39,200 | $129,900 |
| 2024 | $3,198 | $160,300 | $39,200 | $121,100 |
| 2023 | $3,198 | $154,400 | $39,200 | $115,200 |
| 2022 | $3,128 | $151,000 | $39,200 | $111,800 |
| 2021 | $3,120 | $262,800 | $39,200 | $223,600 |
| 2020 | $3,120 | $240,700 | $39,200 | $201,500 |
| 2019 | $2,986 | $138,500 | $39,200 | $99,300 |
| 2018 | $2,902 | $138,500 | $39,200 | $99,300 |
| 2017 | $3,693 | $107,400 | $29,400 | $78,000 |
| 2016 | $3,693 | $107,400 | $29,400 | $78,000 |
| 2015 | $3,640 | $105,904 | $29,400 | $76,504 |
| 2014 | $3,640 | $75,565 | $29,400 | $46,165 |
| 2013 | $2,748 | $75,565 | $29,400 | $46,165 |
Source: Public Records
Map
Nearby Homes
- 826 Daniels St NE
- 832 Daniels St NE
- 829 14th St NE
- 1311 I Ave NE
- 420 16th St NE
- 1046 12th St NE
- 1051 12th St NE
- 1032 Maplewood Dr NE
- 1608 B Ave NE
- 1532 A Ave NE
- 2011 Sierra Cir NE
- 2015 Sierra Cir NE
- 2019 Sierra Cir NE
- 1613 A Ave NE
- 2000 Sierra Cir NE
- 1719 C Ave NE
- 2023 Sierra Cir NE
- 517 18th St NE
- 2006 Sierra Cir NE
- 2103 Sierra Cir NE
- 751 Center Point Rd NE
- 711 Center Point Rd NE
- 748 Center Point Rd NE
- 798 12th St NE
- 1325 G Ave NE
- 803 Center Point Rd NE
- 1329 G Ave NE
- 809 Center Point Rd NE
- 1312 G Ave NE
- 800 12th St NE
- 701 Center Point Rd NE
- 1320 G Ave NE
- 811 Center Point Rd NE
- 1324 G Ave NE
- 806 12th St NE
- 815 Center Point Rd NE
- 1330 G Ave NE
- 1337 G Ave NE
- 810 12th St NE
- 1347 G Ave NE