Estimated Value: $268,558 - $306,000
4
Beds
2
Baths
1,960
Sq Ft
$146/Sq Ft
Est. Value
About This Home
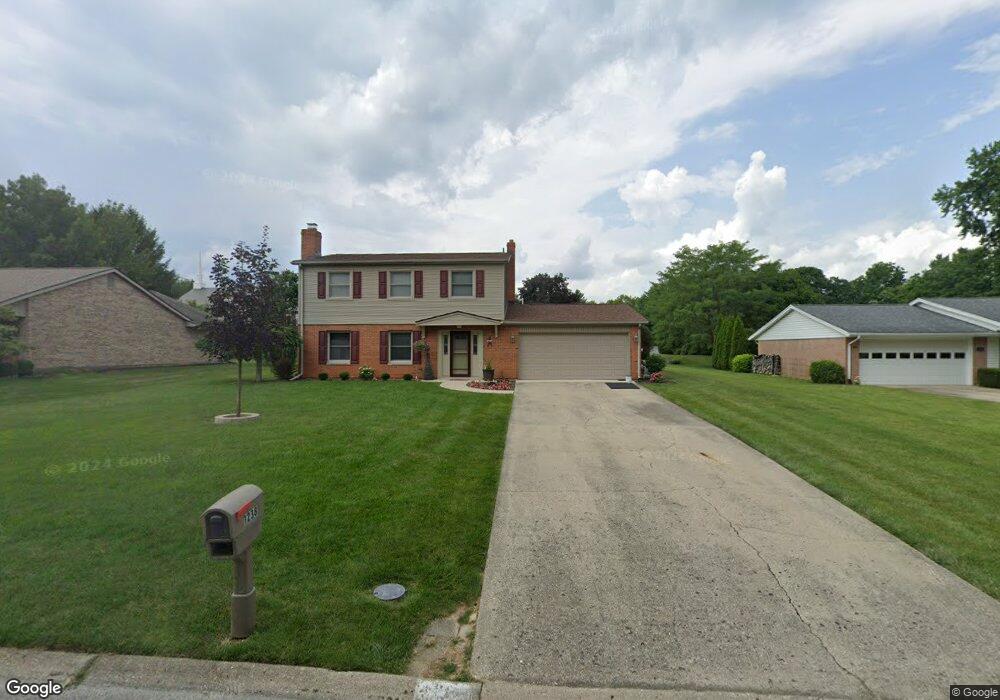
This home is located at 1238 Marwood Dr, Piqua, OH 45356 and is currently estimated at $286,890, approximately $146 per square foot. 1238 Marwood Dr is a home located in Miami County with nearby schools including Washington Primary School, Piqua Junior High School, and Piqua High School.
Ownership History
Date
Name
Owned For
Owner Type
Purchase Details
Closed on
May 22, 2015
Sold by
Beals Amie D and Rinaldi Amie D
Bought by
Trissell David M and Trissell Jennifer M
Current Estimated Value
Home Financials for this Owner
Home Financials are based on the most recent Mortgage that was taken out on this home.
Original Mortgage
$120,000
Outstanding Balance
$92,309
Interest Rate
3.64%
Mortgage Type
FHA
Estimated Equity
$194,581
Purchase Details
Closed on
Feb 8, 2006
Sold by
Baker T Adam and Baker Mollie R
Bought by
Rinaldi Amie D
Purchase Details
Closed on
Mar 26, 1999
Sold by
Selover Kevin R and Selover Vicki L
Bought by
Baker T Adam and Hulme Mollie R
Purchase Details
Closed on
Oct 1, 1986
Bought by
Selover Kevin R
Create a Home Valuation Report for This Property
The Home Valuation Report is an in-depth analysis detailing your home's value as well as a comparison with similar homes in the area
Home Values in the Area
Average Home Value in this Area
Purchase History
| Date | Buyer | Sale Price | Title Company |
|---|---|---|---|
| Trissell David M | $150,000 | Attorney | |
| Rinaldi Amie D | $145,000 | -- | |
| Baker T Adam | $130,000 | -- | |
| Selover Kevin R | $70,000 | -- |
Source: Public Records
Mortgage History
| Date | Status | Borrower | Loan Amount |
|---|---|---|---|
| Open | Trissell David M | $120,000 |
Source: Public Records
Tax History Compared to Growth
Tax History
| Year | Tax Paid | Tax Assessment Tax Assessment Total Assessment is a certain percentage of the fair market value that is determined by local assessors to be the total taxable value of land and additions on the property. | Land | Improvement |
|---|---|---|---|---|
| 2024 | $2,598 | $63,220 | $14,250 | $48,970 |
| 2023 | $2,598 | $63,220 | $14,250 | $48,970 |
| 2022 | $2,643 | $63,220 | $14,250 | $48,970 |
| 2021 | $2,408 | $52,680 | $11,870 | $40,810 |
| 2020 | $2,360 | $52,680 | $11,870 | $40,810 |
| 2019 | $2,373 | $52,680 | $11,870 | $40,810 |
| 2018 | $2,165 | $45,890 | $11,870 | $34,020 |
| 2017 | $2,192 | $45,890 | $11,870 | $34,020 |
| 2016 | $2,167 | $45,890 | $11,870 | $34,020 |
| 2015 | $2,218 | $45,890 | $11,870 | $34,020 |
| 2014 | $2,218 | $45,890 | $11,870 | $34,020 |
| 2013 | $2,225 | $45,890 | $11,870 | $34,020 |
Source: Public Records
Map
Nearby Homes
- 1240 Marwood Dr
- 1236 Marwood Dr
- 1234 Marwood Dr
- 1233 Marwood Dr
- 1229 Marwood Dr
- 1308 W High St
- 1306 W High St
- 1227 Marwood Dr
- 1232 Marwood Dr
- 1230 Marwood Dr
- 1256 W High St
- 1300 W High St
- 1225 Marwood Dr
- 1228 Marwood Dr
- 1508 W High St
- 1223 Marwood Dr
- 220 Lyndhurst Dr
- 1254 W High St
- 1226 Marwood Dr
- 1224 Marwood Dr