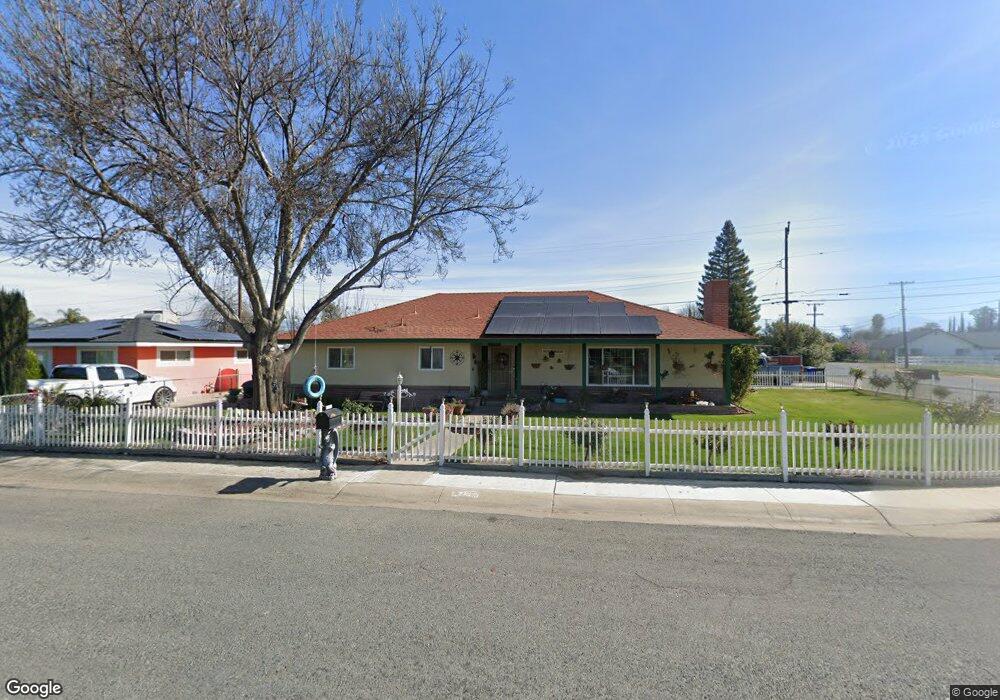
1238 Slaughter Ave Porterville, CA 93257
Southwest Porterville NeighborhoodEstimated Value: $293,684 - $367,000
--
Bed
--
Bath
1,818
Sq Ft
$186/Sq Ft
Est. Value
About This Home
This home is located at 1238 Slaughter Ave, Porterville, CA 93257 and is currently estimated at $338,921, approximately $186 per square foot. 1238 Slaughter Ave is a home located in Tulare County with nearby schools including West Putnam Elementary School, Sequoia Middle School, and Porterville High School.
Ownership History
Date
Name
Owned For
Owner Type
Purchase Details
Closed on
Apr 20, 2006
Sold by
Yocum Barbara S
Bought by
Yocum Shane E
Current Estimated Value
Home Financials for this Owner
Home Financials are based on the most recent Mortgage that was taken out on this home.
Original Mortgage
$144,000
Outstanding Balance
$82,417
Interest Rate
6.29%
Mortgage Type
Stand Alone Refi Refinance Of Original Loan
Estimated Equity
$256,504
Purchase Details
Closed on
Aug 14, 2001
Sold by
Yocum Barbara S
Bought by
Yocum Shane E
Home Financials for this Owner
Home Financials are based on the most recent Mortgage that was taken out on this home.
Original Mortgage
$81,500
Interest Rate
7.09%
Mortgage Type
Purchase Money Mortgage
Purchase Details
Closed on
Feb 19, 1999
Sold by
Finck Michaelyn Mathy
Bought by
Yocum Shane E
Home Financials for this Owner
Home Financials are based on the most recent Mortgage that was taken out on this home.
Original Mortgage
$68,000
Interest Rate
9.99%
Mortgage Type
Purchase Money Mortgage
Create a Home Valuation Report for This Property
The Home Valuation Report is an in-depth analysis detailing your home's value as well as a comparison with similar homes in the area
Home Values in the Area
Average Home Value in this Area
Purchase History
| Date | Buyer | Sale Price | Title Company |
|---|---|---|---|
| Yocum Shane E | -- | Multiple | |
| Yocum Shane E | -- | Chicago Title Co | |
| Yocum Shane E | $85,000 | Chicago Title Co |
Source: Public Records
Mortgage History
| Date | Status | Borrower | Loan Amount |
|---|---|---|---|
| Open | Yocum Shane E | $144,000 | |
| Closed | Yocum Shane E | $81,500 | |
| Previous Owner | Yocum Shane E | $68,000 | |
| Closed | Yocum Shane E | $12,750 |
Source: Public Records
Tax History Compared to Growth
Tax History
| Year | Tax Paid | Tax Assessment Tax Assessment Total Assessment is a certain percentage of the fair market value that is determined by local assessors to be the total taxable value of land and additions on the property. | Land | Improvement |
|---|---|---|---|---|
| 2025 | $1,339 | $133,256 | $31,351 | $101,905 |
| 2024 | $1,339 | $130,644 | $30,737 | $99,907 |
| 2023 | $1,337 | $128,084 | $30,135 | $97,949 |
| 2022 | $1,294 | $125,574 | $29,545 | $96,029 |
| 2021 | $1,277 | $123,112 | $28,966 | $94,146 |
| 2020 | $1,263 | $121,850 | $28,669 | $93,181 |
| 2019 | $1,239 | $119,461 | $28,107 | $91,354 |
| 2018 | $1,215 | $117,119 | $27,556 | $89,563 |
| 2017 | $1,184 | $114,823 | $27,016 | $87,807 |
| 2016 | $1,135 | $112,571 | $26,486 | $86,085 |
| 2015 | $1,089 | $110,880 | $26,088 | $84,792 |
| 2014 | $1,089 | $108,708 | $25,577 | $83,131 |
Source: Public Records
Map
Nearby Homes
- 66 S Beverly St
- 1127 W Orange Ave
- 1066 W Forest Ave
- 53 N Prospect St
- 1262 Tomah Ave
- 1140 Tomah Ave
- 1147 W Putnam Ave
- 1137 W Putnam Ave
- 63 N Wisconsin St
- 553 S Cloverleaf St
- 1502 W River Ave
- 643 S Cloverleaf St
- 1573 W River Ave
- 1343 W Morton Ave Unit Sp 84
- 360 N Capitola Ct Unit 4
- 0 W Morton Unit 234694
- 36 S Chess Terrace St
- 474 Douglas St
- 0 SE Indianna & Springville Dr Unit 221030
- 1087 W Belleview Ave
- 1238 W Slaughter Ave
- 1242 Slaughter Ave
- 1242 W Slaughter Ave
- 151 S Prospect St
- 1237 W Roby Ave
- 137 S Prospect St
- 1254 W Roby Ave
- 1250 Slaughter Ave
- 1241 Slaughter Ave
- 125 S Prospect St
- 1249 W Roby Ave
- 1245 Slaughter Ave
- 1272 W Roby Ave
- 1255 W Roby Ave
- 115 S Prospect St
- 1253 S Slaughter
- 1253 Slaughter Ave
- 1192 W Roby Ave
- 191 S Prospect St
- 191 S Prospect St