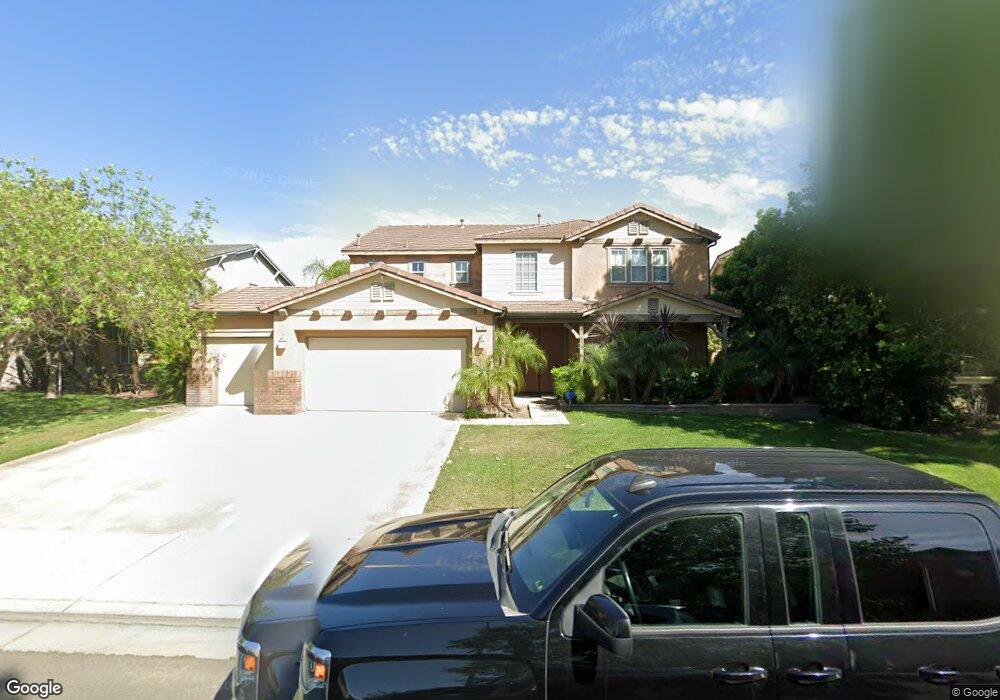
12383 Black Horse St Mira Loma, CA 91752
Estimated Value: $941,678 - $993,000
3
Beds
3
Baths
3,310
Sq Ft
$295/Sq Ft
Est. Value
About This Home
This home is located at 12383 Black Horse St, Mira Loma, CA 91752 and is currently estimated at $976,920, approximately $295 per square foot. 12383 Black Horse St is a home located in Riverside County with nearby schools including Louis Vandermolen Fundamental Elementary School, River Heights Intermediate School, and Eleanor Roosevelt High School.
Ownership History
Date
Name
Owned For
Owner Type
Purchase Details
Closed on
Sep 4, 2009
Sold by
The Bank Of New York Mellon
Bought by
Sanchez Victor E Enciso and Enciso Diana
Current Estimated Value
Home Financials for this Owner
Home Financials are based on the most recent Mortgage that was taken out on this home.
Original Mortgage
$348,570
Outstanding Balance
$228,657
Interest Rate
5.25%
Mortgage Type
FHA
Estimated Equity
$748,263
Purchase Details
Closed on
May 27, 2009
Sold by
Orozco Sergio
Bought by
The Bank Of New York Mellon and The Bank Of New York
Purchase Details
Closed on
Nov 19, 2006
Sold by
Kb Home Greater Los Angeles Inc
Bought by
Orozco Sergio
Home Financials for this Owner
Home Financials are based on the most recent Mortgage that was taken out on this home.
Original Mortgage
$479,200
Interest Rate
6.37%
Mortgage Type
New Conventional
Create a Home Valuation Report for This Property
The Home Valuation Report is an in-depth analysis detailing your home's value as well as a comparison with similar homes in the area
Home Values in the Area
Average Home Value in this Area
Purchase History
| Date | Buyer | Sale Price | Title Company |
|---|---|---|---|
| Sanchez Victor E Enciso | $355,000 | Landsafe Title | |
| The Bank Of New York Mellon | $261,375 | Landsafe Title | |
| The Bank Of New York Mellon | $261,375 | Landsafe Title | |
| Orozco Sergio | $599,000 | First American Title Nhs |
Source: Public Records
Mortgage History
| Date | Status | Borrower | Loan Amount |
|---|---|---|---|
| Open | Sanchez Victor E Enciso | $348,570 | |
| Previous Owner | Orozco Sergio | $479,200 |
Source: Public Records
Tax History Compared to Growth
Tax History
| Year | Tax Paid | Tax Assessment Tax Assessment Total Assessment is a certain percentage of the fair market value that is determined by local assessors to be the total taxable value of land and additions on the property. | Land | Improvement |
|---|---|---|---|---|
| 2025 | $8,509 | $458,219 | $141,977 | $316,242 |
| 2023 | $8,509 | $440,428 | $136,465 | $303,963 |
| 2022 | $8,296 | $431,793 | $133,790 | $298,003 |
| 2021 | $8,223 | $423,327 | $131,167 | $292,160 |
| 2020 | $8,159 | $418,988 | $129,823 | $289,165 |
| 2019 | $8,051 | $410,774 | $127,278 | $283,496 |
| 2018 | $7,941 | $402,721 | $124,784 | $277,937 |
| 2017 | $7,821 | $394,826 | $122,338 | $272,488 |
| 2016 | $7,751 | $387,086 | $119,940 | $267,146 |
| 2015 | $7,675 | $381,274 | $118,140 | $263,134 |
| 2014 | $7,651 | $373,808 | $115,827 | $257,981 |
Source: Public Records
Map
Nearby Homes
- 6573 Harrow St
- 6396 Pictor Ct
- 12456 Cassiopeia Ct
- 6386 Delgado Ln
- 6512 Caxton St
- 12463 Phoenix Ct
- 12466 Quintessa Ln
- 12533 Cipriano Ln
- 12450 Travanca Ln
- 6502 Marigold St
- 6272 Cristal Ln
- 6291 Amarante Ln Unit 227
- 6740 Goldy St
- 6800 Knightsbridge Ct
- 6334 Pomegranate Ct
- 6861 Rio Grande Dr
- 6933 Rio Grande Dr
- 6486 Gladiola St
- 12851 Oakdale St
- 11958 Sunstone Ct
- 12373 Black Horse St
- 12393 Black Horse St
- 6549 Wells Springs St
- 6559 Wells Springs St
- 12403 Black Horse St
- 12363 Black Horse St
- 6539 Wells Springs St
- 12329 White Horse Ct
- 6569 Wells Springs St
- 12326 White Horse Ct
- 6529 Wells Springs St
- 12400 Black Horse #22 St
- 12400 Black Horse St
- 12353 Black Horse St
- 12306 Caledonia Ct
- 12339 White Horse Ct
- 12420 Black Horse St
- 6579 Wells Springs St
- 12336 White Horse Ct
- 12425 Marble Way