Estimated Value: $637,000 - $786,000
--
Bed
--
Bath
7,411
Sq Ft
$92/Sq Ft
Est. Value
About This Home
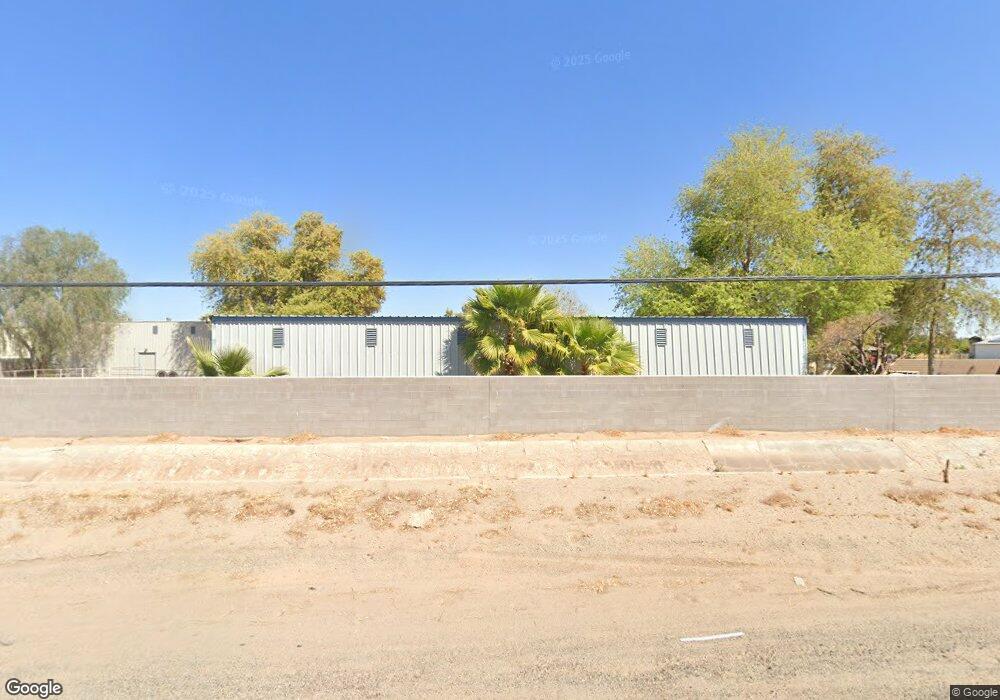
This home is located at 12385 S Avenue 5 E, Yuma, AZ 85365 and is currently estimated at $684,937, approximately $92 per square foot. 12385 S Avenue 5 E is a home located in Yuma County with nearby schools including James B. Rolle Elementary School, Gila Vista Junior High School, and Yuma High School.
Ownership History
Date
Name
Owned For
Owner Type
Purchase Details
Closed on
Sep 17, 2013
Sold by
Ringwald Rose
Bought by
Ringwald Shawn
Current Estimated Value
Home Financials for this Owner
Home Financials are based on the most recent Mortgage that was taken out on this home.
Original Mortgage
$264,000
Outstanding Balance
$195,987
Interest Rate
4.27%
Mortgage Type
New Conventional
Estimated Equity
$488,950
Purchase Details
Closed on
Mar 17, 2005
Sold by
Priest Rodney R and Priest Dorothy A
Bought by
Priest Rodney R and Priest Dorothy A
Purchase Details
Closed on
Mar 29, 2004
Sold by
Frick Robert G and Frick Esther V
Bought by
Priest Rodney R and Priest Dorothy A
Home Financials for this Owner
Home Financials are based on the most recent Mortgage that was taken out on this home.
Original Mortgage
$208,000
Interest Rate
5.77%
Mortgage Type
New Conventional
Purchase Details
Closed on
Nov 30, 2000
Sold by
Frick Robert G and Frick Esther V
Bought by
Frick Robert G and Frick Esther V
Create a Home Valuation Report for This Property
The Home Valuation Report is an in-depth analysis detailing your home's value as well as a comparison with similar homes in the area
Home Values in the Area
Average Home Value in this Area
Purchase History
| Date | Buyer | Sale Price | Title Company |
|---|---|---|---|
| Ringwald Shawn | -- | Pioneer Title Agency | |
| Ringwald Shawn | $330,000 | Pioneer Title Agency | |
| Priest Rodney R | -- | -- | |
| Priest Rodney R | $260,000 | Citizens Title | |
| Frick Robert G | -- | -- |
Source: Public Records
Mortgage History
| Date | Status | Borrower | Loan Amount |
|---|---|---|---|
| Open | Ringwald Shawn | $264,000 | |
| Previous Owner | Priest Rodney R | $208,000 |
Source: Public Records
Tax History Compared to Growth
Tax History
| Year | Tax Paid | Tax Assessment Tax Assessment Total Assessment is a certain percentage of the fair market value that is determined by local assessors to be the total taxable value of land and additions on the property. | Land | Improvement |
|---|---|---|---|---|
| 2025 | $2,904 | $30,526 | $6,387 | $24,139 |
| 2024 | $2,874 | $29,073 | $6,253 | $22,820 |
| 2023 | $2,874 | $27,689 | $4,881 | $22,808 |
| 2022 | $2,774 | $26,370 | $4,994 | $21,376 |
| 2021 | $2,928 | $25,114 | $4,528 | $20,586 |
| 2020 | $2,672 | $23,918 | $3,454 | $20,464 |
| 2019 | $2,641 | $22,780 | $2,900 | $19,880 |
| 2018 | $2,534 | $21,695 | $2,745 | $18,950 |
| 2017 | $2,431 | $21,695 | $2,745 | $18,950 |
| 2016 | $2,495 | $19,678 | $2,825 | $16,853 |
| 2015 | $2,196 | $18,740 | $3,392 | $15,348 |
| 2014 | $2,196 | $19,473 | $4,770 | $14,703 |
Source: Public Records
Map
Nearby Homes
- 7133 E 45th St
- 7147 E 45th St
- 7161 E 45th St
- 4074 S Avenue 5 1 2 E
- 72324091 E County 12 1 2 St
- 0000 S Avenue 4 3 4 E
- 5691 E 44th Pkwy
- 5444 E 39th St
- 5648 E 45th Place
- 5648 E 45th Place
- 5663 E 45th St
- 5693 E 44th Place
- 5693 E 44th Place
- 5722 E 44th Pkwy
- 5679 E 45th St
- 5679 E 45th St
- 5709 E 44th Place
- 5695 E 45th St
- 12815 S Greenview Way
- 4779 E County 13th St
- 5021 E Mesa View St
- 5061 E Mesa View St
- 12433 S Avenue 5 E
- 5125 E Mesa View St
- 12449 S Avenue 5 E
- 5050 E Mesa View St
- 12475 S Avenue 5 E
- 5108 E Mesa View St
- 12395 S Avenue 5 E
- 5177 E Mesa View St
- 5144 E Mesa View St
- 5074 Mesa View St
- 5168 E Mesa View St
- 12479 S Avenue 5 E
- 12447 S Avenue 5 E
- 5186 E Mesa View St
- 5233 E Mesa View St
- 0 S Avenue 5 E
- 12551 S Avenue 5 E
- 15150 S Avenue 5 E