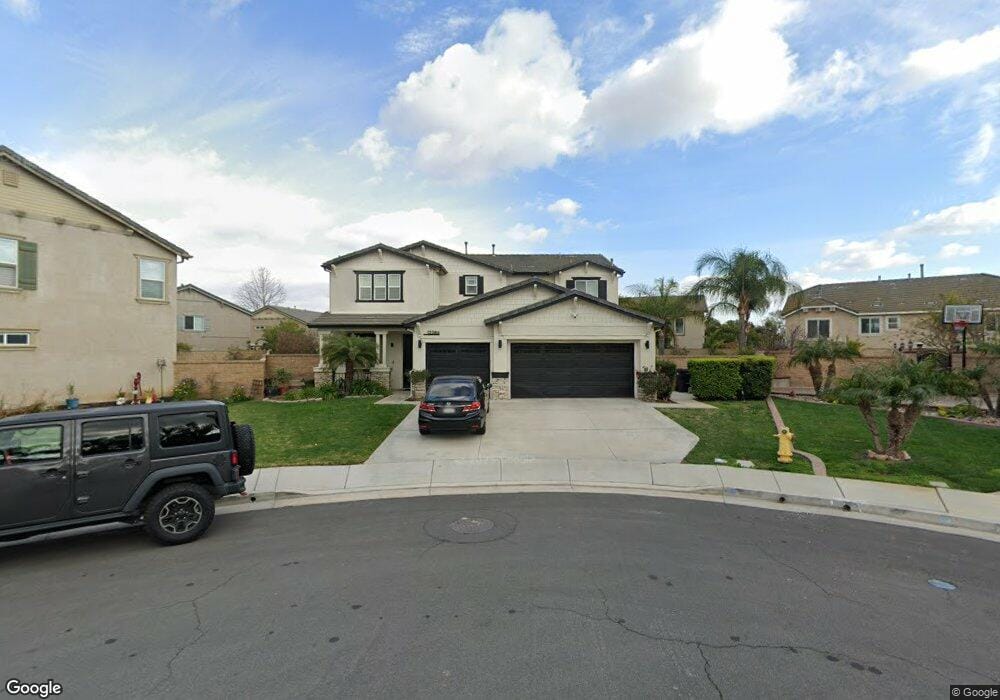
12386 Blackmoor Ct Mira Loma, CA 91752
Estimated Value: $957,000 - $1,056,000
5
Beds
3
Baths
3,310
Sq Ft
$307/Sq Ft
Est. Value
About This Home
This home is located at 12386 Blackmoor Ct, Mira Loma, CA 91752 and is currently estimated at $1,015,658, approximately $306 per square foot. 12386 Blackmoor Ct is a home located in Riverside County with nearby schools including Louis Vandermolen Fundamental Elementary School, River Heights Intermediate School, and Eleanor Roosevelt High School.
Ownership History
Date
Name
Owned For
Owner Type
Purchase Details
Closed on
Feb 15, 2007
Sold by
Kb Home Greater Los Angeles Inc
Bought by
Silva Larry and Silva Angelica M
Current Estimated Value
Home Financials for this Owner
Home Financials are based on the most recent Mortgage that was taken out on this home.
Original Mortgage
$483,179
Interest Rate
6.73%
Mortgage Type
Purchase Money Mortgage
Create a Home Valuation Report for This Property
The Home Valuation Report is an in-depth analysis detailing your home's value as well as a comparison with similar homes in the area
Home Values in the Area
Average Home Value in this Area
Purchase History
| Date | Buyer | Sale Price | Title Company |
|---|---|---|---|
| Silva Larry | $604,000 | First American Title Co Nhs |
Source: Public Records
Mortgage History
| Date | Status | Borrower | Loan Amount |
|---|---|---|---|
| Previous Owner | Silva Larry | $483,179 |
Source: Public Records
Tax History Compared to Growth
Tax History
| Year | Tax Paid | Tax Assessment Tax Assessment Total Assessment is a certain percentage of the fair market value that is determined by local assessors to be the total taxable value of land and additions on the property. | Land | Improvement |
|---|---|---|---|---|
| 2025 | $12,738 | $847,133 | $262,688 | $584,445 |
| 2023 | $12,738 | $814,240 | $252,489 | $561,751 |
| 2022 | $12,392 | $798,276 | $247,539 | $550,737 |
| 2021 | $11,254 | $694,652 | $215,954 | $478,698 |
| 2020 | $10,405 | $620,225 | $192,816 | $427,409 |
| 2019 | $10,179 | $602,160 | $187,200 | $414,960 |
| 2018 | $9,895 | $579,000 | $180,000 | $399,000 |
| 2017 | $9,290 | $528,000 | $164,000 | $364,000 |
| 2016 | $9,299 | $526,000 | $163,000 | $363,000 |
| 2015 | $9,177 | $517,000 | $160,000 | $357,000 |
| 2014 | $8,956 | $494,000 | $153,000 | $341,000 |
Source: Public Records
Map
Nearby Homes
- 6396 Pictor Ct
- 6512 Caxton St
- 6386 Delgado Ln
- 12463 Phoenix Ct
- 6573 Harrow St
- 12533 Cipriano Ln
- 12466 Quintessa Ln
- 6502 Marigold St
- 12450 Travanca Ln
- 6272 Cristal Ln
- 6291 Amarante Ln Unit 227
- 6740 Goldy St
- 6334 Pomegranate Ct
- 12545 Current Dr
- 6800 Knightsbridge Ct
- 6861 Rio Grande Dr
- 6486 Gladiola St
- 12851 Oakdale St
- 6933 Rio Grande Dr
- 12931 Royale Dr
- 12396 Blackmoor Ct
- 12399 Blackmoor Ct
- 12400 Black Horse St
- 12420 Black Horse St
- 12400 Black Horse #22 St
- 12339 White Horse Ct
- 12430 Black Horse St
- 12329 White Horse Ct
- 12349 White Horse Ct
- 12440 Black Horse St
- 6544 Moonriver St
- 6514 Moonriver St
- 6564 Moonriver St
- 12460 Black Horse St
- 6504 Moonriver St
- 12413 Black Horse St
- 12470 Black Horse St
- 12403 Black Horse St
- 12346 White Horse Ct
- 12433 Black Horse St