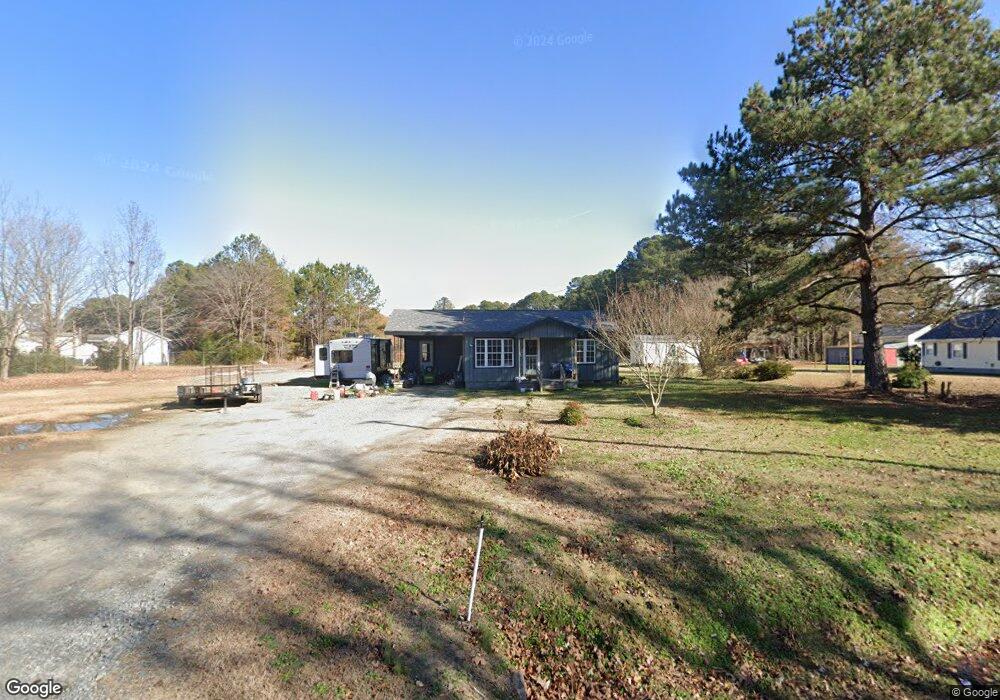
1239 Brogden Rd Smithfield, NC 27577
Estimated Value: $148,000 - $269,000
3
Beds
1
Bath
1,196
Sq Ft
$171/Sq Ft
Est. Value
About This Home
This home is located at 1239 Brogden Rd, Smithfield, NC 27577 and is currently estimated at $204,013, approximately $170 per square foot. 1239 Brogden Rd is a home located in Johnston County with nearby schools including West Smithfield Elementary School, Smithfield Middle School, and Smithfield-Selma High School.
Ownership History
Date
Name
Owned For
Owner Type
Purchase Details
Closed on
May 27, 2025
Sold by
Rijkdom Realty Partners Llc
Bought by
Paniagua Jose I
Current Estimated Value
Home Financials for this Owner
Home Financials are based on the most recent Mortgage that was taken out on this home.
Original Mortgage
$148,410
Outstanding Balance
$147,747
Interest Rate
6.62%
Mortgage Type
New Conventional
Estimated Equity
$56,266
Purchase Details
Closed on
Sep 2, 2022
Sold by
Cook Terry Michael and Cook Kimberly
Bought by
Rijkdom Realty Partners Llc
Home Financials for this Owner
Home Financials are based on the most recent Mortgage that was taken out on this home.
Original Mortgage
$40,000
Interest Rate
5.66%
Mortgage Type
New Conventional
Purchase Details
Closed on
Dec 30, 2021
Sold by
Parrish Lynda Hardee
Bought by
Cook Terry Michael
Create a Home Valuation Report for This Property
The Home Valuation Report is an in-depth analysis detailing your home's value as well as a comparison with similar homes in the area
Home Values in the Area
Average Home Value in this Area
Purchase History
| Date | Buyer | Sale Price | Title Company |
|---|---|---|---|
| Paniagua Jose I | $153,000 | None Listed On Document | |
| Paniagua Jose I | $153,000 | None Listed On Document | |
| Rijkdom Realty Partners Llc | $160,000 | None Listed On Document | |
| Rijkdom Realty Partners Llc | $160,000 | None Listed On Document | |
| Cook Terry Michael | -- | None Available |
Source: Public Records
Mortgage History
| Date | Status | Borrower | Loan Amount |
|---|---|---|---|
| Open | Paniagua Jose I | $148,410 | |
| Closed | Paniagua Jose I | $148,410 | |
| Previous Owner | Rijkdom Realty Partners Llc | $40,000 | |
| Previous Owner | Rijkdom Realty Partners Llc | $144,000 |
Source: Public Records
Tax History
| Year | Tax Paid | Tax Assessment Tax Assessment Total Assessment is a certain percentage of the fair market value that is determined by local assessors to be the total taxable value of land and additions on the property. | Land | Improvement |
|---|---|---|---|---|
| 2025 | $1,513 | $238,340 | $114,300 | $124,040 |
| 2024 | $1,047 | $129,220 | $71,440 | $57,780 |
| 2023 | $1,047 | $129,220 | $71,440 | $57,780 |
| 2022 | $995 | $117,020 | $59,240 | $57,780 |
| 2021 | $995 | $117,020 | $59,240 | $57,780 |
| 2020 | $1,030 | $117,020 | $59,240 | $57,780 |
| 2019 | $1,030 | $117,020 | $59,240 | $57,780 |
| 2018 | $941 | $104,560 | $59,240 | $45,320 |
| 2017 | $941 | $104,560 | $59,240 | $45,320 |
| 2016 | $941 | $104,560 | $59,240 | $45,320 |
| 2015 | $931 | $104,560 | $59,240 | $45,320 |
| 2014 | $931 | $104,560 | $59,240 | $45,320 |
Source: Public Records
Map
Nearby Homes
- 1259 Brogden Rd
- 1195 Brogden Rd
- 91 Old Dupree Rd
- 1324 Brogden Rd
- 117 Old Dupree Rd
- 131 Old Dupree Rd
- 1374 Brogden Rd
- 326 Ocean Dr
- 000 Whitley Farm Rd
- 72 Victory View Terrace E
- 143 Old Dupree Rd
- 181 N Landing
- 1475 Brogden Rd
- 1450 Brogden Rd
- 834 Martin St
- 833 Martin St
- 113 Hazel Ln
- 34 Lars Ln
- 4407 S Us 301 Hwy
- 823 Brogden Rd
Your Personal Tour Guide
Ask me questions while you tour the home.