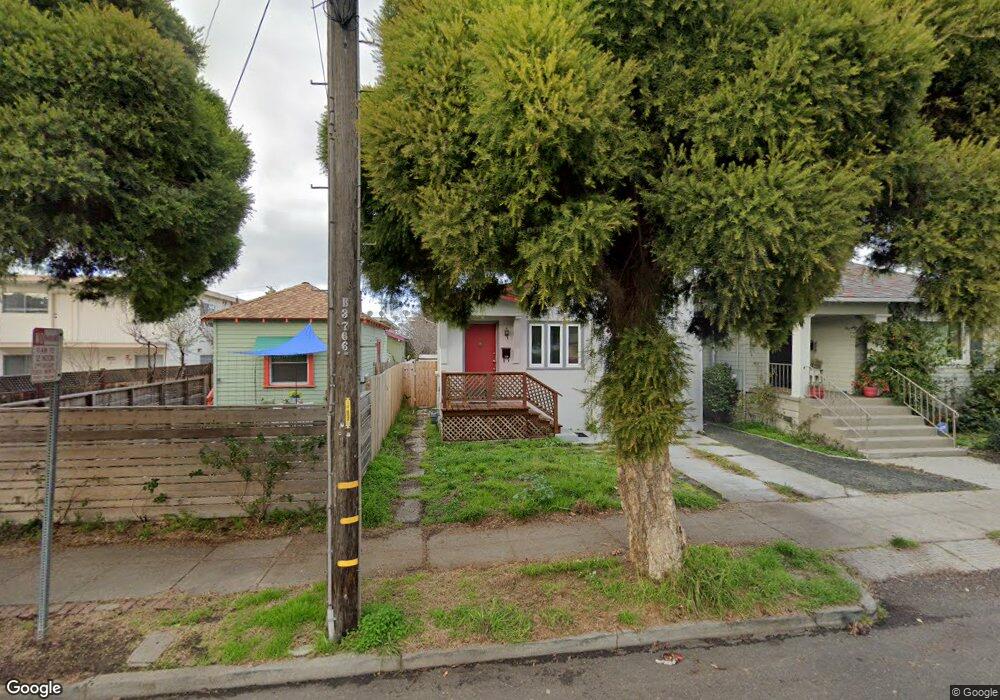
1239 Carrison St Berkeley, CA 94702
West Berkeley NeighborhoodEstimated Value: $847,000 - $1,095,000
1
Bed
1
Bath
676
Sq Ft
$1,435/Sq Ft
Est. Value
About This Home
This home is located at 1239 Carrison St, Berkeley, CA 94702 and is currently estimated at $970,124, approximately $1,435 per square foot. 1239 Carrison St is a home located in Alameda County with nearby schools including Malcolm X Elementary School, Oxford Elementary School, and Washington Elementary School.
Ownership History
Date
Name
Owned For
Owner Type
Purchase Details
Closed on
Apr 7, 2025
Sold by
Jackson David L and Jackson Cinnamon E
Bought by
David Jackson Iii And Cinnamon Jackson Revoca and Jackson
Current Estimated Value
Purchase Details
Closed on
Aug 10, 2016
Sold by
Harmeyer Robert J
Bought by
Jackson David L and Jackson Cinnamon E
Home Financials for this Owner
Home Financials are based on the most recent Mortgage that was taken out on this home.
Original Mortgage
$448,000
Interest Rate
3.48%
Mortgage Type
New Conventional
Create a Home Valuation Report for This Property
The Home Valuation Report is an in-depth analysis detailing your home's value as well as a comparison with similar homes in the area
Home Values in the Area
Average Home Value in this Area
Purchase History
| Date | Buyer | Sale Price | Title Company |
|---|---|---|---|
| David Jackson Iii And Cinnamon Jackson Revoca | -- | None Listed On Document | |
| Jackson David L | $560,000 | First American Title Company |
Source: Public Records
Mortgage History
| Date | Status | Borrower | Loan Amount |
|---|---|---|---|
| Previous Owner | Jackson David L | $448,000 |
Source: Public Records
Tax History
| Year | Tax Paid | Tax Assessment Tax Assessment Total Assessment is a certain percentage of the fair market value that is determined by local assessors to be the total taxable value of land and additions on the property. | Land | Improvement |
|---|---|---|---|---|
| 2025 | $11,998 | $761,979 | $348,168 | $420,811 |
| 2024 | $11,998 | $746,905 | $341,343 | $412,562 |
| 2023 | $11,694 | $739,124 | $334,650 | $404,474 |
| 2022 | $11,432 | $717,632 | $328,089 | $396,543 |
| 2021 | $11,462 | $703,426 | $321,657 | $388,769 |
| 2020 | $10,409 | $662,272 | $318,360 | $343,912 |
| 2019 | $9,637 | $603,624 | $312,120 | $291,504 |
| 2018 | $8,612 | $571,200 | $306,000 | $265,200 |
| 2017 | $8,389 | $560,000 | $300,000 | $260,000 |
| 2016 | $3,482 | $152,178 | $45,653 | $106,525 |
| 2015 | $3,426 | $149,893 | $44,968 | $104,925 |
| 2014 | $3,388 | $146,957 | $44,087 | $102,870 |
Source: Public Records
Map
Nearby Homes
- 1237 Ashby Ave
- 3032 Mabel St
- 1314 Ashby Ave
- 1080 67th St
- 6628 Helen Ct
- 6500 San Pablo Ave
- 2922 Stanton St
- 6501 San Pablo Ave Unit 410
- 2751 Wallace St
- 6465 San Pablo Ave Unit 203
- 2747 San Pablo Ave Unit 507
- 1126 Ocean Ave
- 1507 Prince St
- 1034 Grayson St
- 3101 Sacramento St
- 1164 Ocean Ave
- 1200 65th St Unit 224
- 1010 Grayson St
- 1156 64th St
- 1535 Julia St
- 1241 Carrison St
- 1237 Carrison St
- 1247 Carrison St
- 1233 Carrison St
- 1251 Carrison St
- 1238 Ashby Ave
- 1231 Carrison St
- 1236 Ashby Ave
- 1244 Ashby Ave
- 1246 Ashby Ave
- 1234 Ashby Ave
- 1253 Carrison St
- 1229 Carrison St
- 1216 Carrison St
- 1248 Ashby Ave
- 1255 Carrison St
- 1240 Carrison St
- 1226 Carrison St
- 1225 Carrison St
- 1244 Carrison St
Your Personal Tour Guide
Ask me questions while you tour the home.